Subscribers to iSPYETF’s free e-mail newsletter receive a market outlook, usually once a week. The market outlook below was sent out on March 10, 2022. If you’d like to sign up for the free e-newsletter, you may do so here (we will never share your e-mail with anyone, just as we don't accept advertising).
Oil prices have gone parabolic and in California (even at Costco) we're paying almost $6 for a gallon of gas.
I remember back in 2008, the last time oil soared like this, the pervasive narrative was that rising oil kills the economy (and stocks). This narrative resurfaced in 2011 and 2017.
Do rising oil prices really kill stocks and the economy?
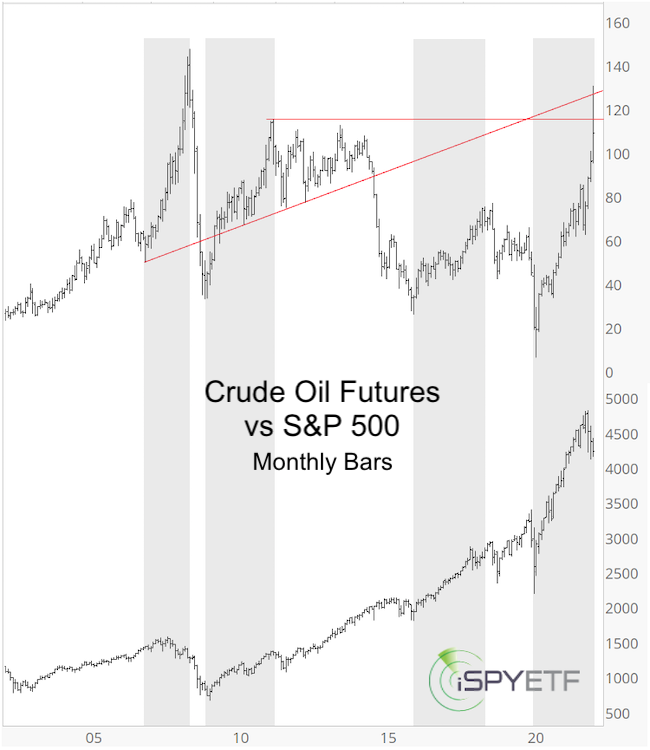
The chart below plots oil prices against the S&P 500 and highlights periods of rising oil. While this did eventually have an effect on stocks in 2008/09, it didn't matter in 2011, 2017, 2020/21.
Let's zoom out further and use a rules-based approach to identify similar precedents of rising oil prices. On Tuesday, crude oil closed 60.61% above its 200-day SMA. This is not the highest ever reading, but it's up there.
The chart below identifies all other times when oil prices traded more than 40% above their 200-day SMA. There are 4 distinct clusters. Around 1990, 1999, 2008, 2020.
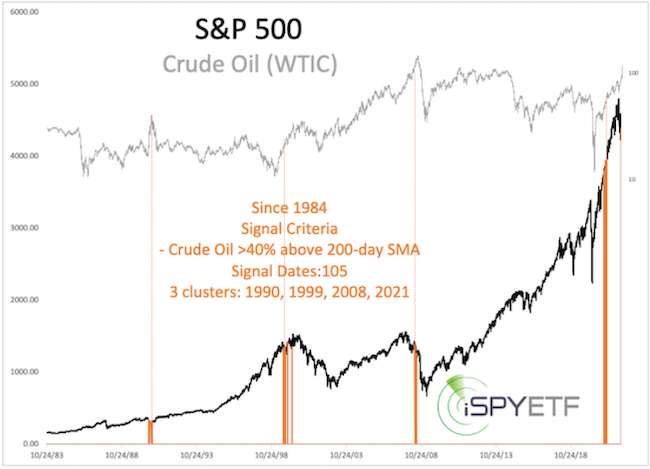
2008 was the only instance with an immediate effect (the decline, however, started already earlier and was triggered by the financial crisis).
The first signal in 1999 was followed by one more rally leg to new S&P highs.
Perhaps more interesting is that crude oil prices (gray graph) didn't do that well after similar situations.
The Profit Radar Report was bullish oil for 2022, but the developments in Russia/Ukraine intensified the move we expected.
Sunday's Profit Radar Report highlighted resistance (red lines, shown in the first chart) and warned that now is not the time to chase price (crude oil has fallen as much as 20% in the last 3 days).
As regular readers know, I've been following the expanding diagonal pattern, which was first published on February 3, again on February 24 and March 3.
Thus far, the pattern (and its down side target) has not been invalidated.
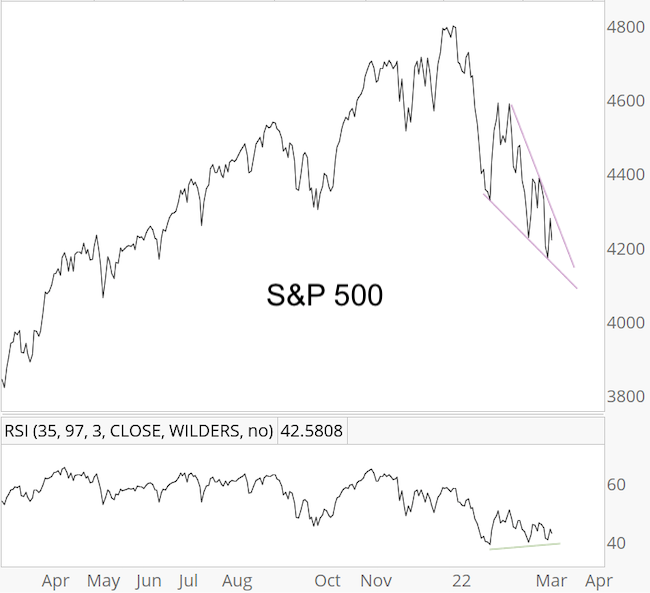
Regardless of the pattern, I warned in the February 6 Profit Radar Report that we are entering a period of extreme choppiness.
This was emphasized again in the February 20 Profit Radar Report, which stated that: "In terms of timing, a low in March would be preferred, which could mean a stair-step decline lower)."
The S&P 500 is getting closer to a potential bounce in terms of timing. I would still like to see one more nasty washout day that meets certain requirements to pull the trigger.
To find out what my S&P 500 buy limit is and to get a continuous flow of fact-based quality research, sign up for the Profit Radar Report.
The Profit Radar Report comes with a 30-day money back guarantee, but fair warning: 90% of users stay on beyond 30 days.
Barron's rates iSPYETF a "trader with a good track record," and Investor's Business Daily writes "Simon says and the market is playing along."
|
