In terms of seasonality, December is the strongest month of the year. Nevertheless, the S&P 500 is down almost 2% since its December 1st pop. Why?
One reason is buyers’ fatigue.
The December 6 Profit Radar Report featured the following analysis:
“The S&P 500 rallied 2.01% on Friday. Since the beginning of 2011, the S&P 500 gained more than 2% on 21 days. On average, 2171 stocks advanced (based on NYSE advancers/decliners) on those days. On Friday, only 953 stocks advanced. In other words, breadth behind Friday’s gain was dismal. The chart below lists all 2%+ S&P 500 gains since 2011 and the accompanying NYSE advance number (inversed for easier viewing).
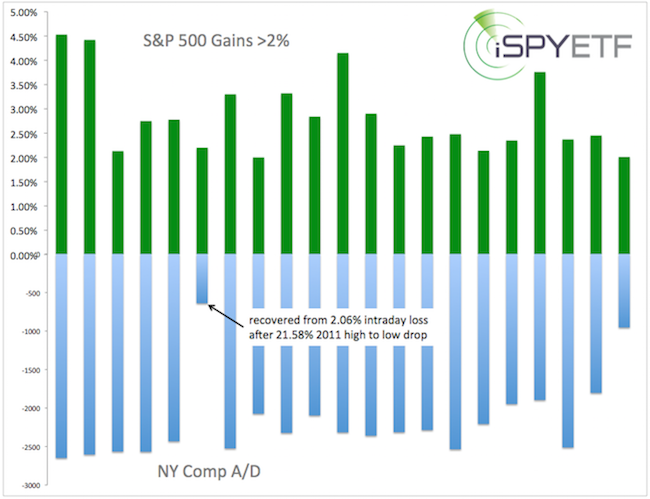
Our various gauges of internal strength show additional weakening since the December 1 spike high. This is in harmony with the notion that the 2009 bull market is losing steam, but conflicts with bullish seasonality into Q1/Q2 2016.”
If you enjoy quality, hand-crafted research, >> Sign up for the FREE iSPYETF Newsletter
Seasonality still suggests further gains, but based on market breadth (or lack thereof), risk management is becoming more important.
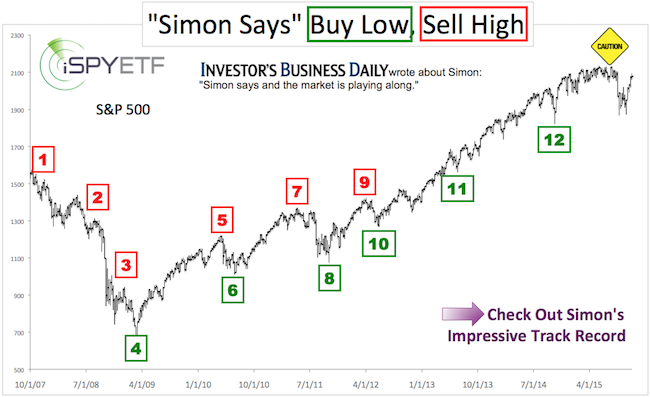
A long-term analysis of market breadth (or liquidity) shows why stocks are struggling and even a major market top has become more likely. More details available here: Long-term Liquidity Analysis
Simon Maierhofer is the publisher of the Profit Radar Report. The Profit Radar Report presents complex market analysis (S&P 500, Dow Jones, gold, silver, euro and bonds) in an easy format. Technical analysis, sentiment indicators, seasonal patterns and common sense are all wrapped up into two or more easy-to-read weekly updates. All Profit Radar Report recommendations resulted in a 59.51% net gain in 2013 and 17.59% in 2014.
Follow Simon on Twitter @ iSPYETF or sign up for the FREE iSPYETF Newsletter to get actionable ETF trade ideas delivered for free.
If you enjoy quality, hand-crafted research, >> Sign up for the FREE iSPYETF Newsletter
|
