This report was originally published in the December 14 Profit Radar Report:
There is some concern that the drop in oil prices will push stocks into a bear market, similar to what happened in 2008. We live in a complex world, and here are some of the ripple effects caused by falling oil prices. A bear market is not necessarily one of them.
Low Oil Prices = Economic Stimulus
According to the U.S. Energy Information Administration (EIA), the United States consumes about 11.5 billion gallons of gasoline and 567 million barrels of crude oil per month (based on 2013 data).
Since late June, the price of regular gas fell from $3.8/gallon to $2.5/gallon. A $1.30 drop in gas prices translates into a monthly savings of almost $15 billion for U.S. drivers.
Since late June, crude oil prices fell from $107/barrel to $58. A $49 drop in crude oil prices translates into a monthly savings of $28 billion.
Without help from the Federal Reserve, the oil market just delivered an ‘economic stimulus’ that could be valued somewhere around $43 billion a month.
Oil vs S&P 500
This year's oil price collapse differs from the 2008 collapse relative to the S&P 500 (NYSEArca: SPY). In 2008, the S&P 500 topped before oil did. In fact, the S&P 500 recorded its all-time high in October 2007 and was already down 21% by the time oil topped on July 11, 2008.
In 2014, the S&P 500 recorded new all-time highs five months after oil (NYSEArca: USO) started to decline.
The chart below plots oil against the S&P 500 and shows that falling oil (NYSEArca: OIL) prices are not consistently bearish for stocks.
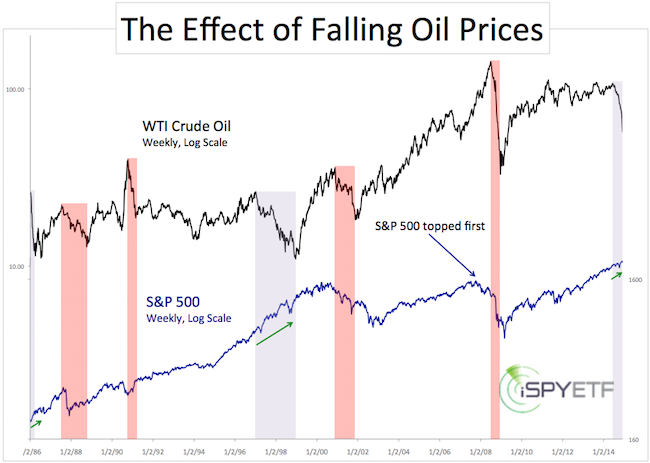
Falling oil prices after unusual spikes or bubbles (1990 Iraq war, 2008 commodity bubble – red shading) have a bigger effect on stocks than falling oil prices after a periods of consolidation (gray shading).
The 2014 meltdown came after a year of sideways trading. If history can be used as a guide, stocks are likely to hold up despite the oil meltdown.
Oil & the Hindenburg Omen
The ominous Hindenburg Omen showed up multiple times in December. The media has published numerous Hindenburg gloom and doom articles in recent years. The most recent Hindenburg clusters occurred in May/June and August 2013 without effect on stocks.
A number of requirements need to be met to trigger the Omen, one of them is a spike of new NYSE highs and lows.
Declining oil prices sent many energy stocks to new lows. Those new lows contribute to the Hindenburg Omen requirements and the resulting signal.
Oil & the Energy Sector
98% of stocks included in the Energy Select Sector SPDR ETF (XLE) are trading below their 50-day SMA. XLE is extremely oversold. The immediate downside from such on oversold condition is limited. A bounce in energy stocks will serve as tailwind for broad markets. UPDATE: XLE just deliverd the most bullish action since June. Will it stick? More details here: XLE Delivers Promising Rally
According to JP Morgan, oil firms account for 18% of the high yield bond market, which explains the 10% drop in junk bond ETFs like JNK (detailed analysis of JNK is available to Profit Radar Report subscribers).
The rest of the report along with detailed analysis for U.S. stocks and oil is available to subscribers of the Profit Radar Report.
Simon Maierhofer is the publisher of the Profit Radar Report. The Profit Radar Report presents complex market analysis (S&P 500, Dow Jones, gold, silver, euro and bonds) in an easy format. Technical analysis, sentiment indicators, seasonal patterns and common sense are all wrapped up into two or more easy-to-read weekly updates. All Profit Radar Report recommendations resulted in a 59.51% net gain in 2013.
Follow Simon on Twitter @ iSPYETF to get actionable ETF trade ideas delivered for free.

|
