At the end of last week we saw some excessive pessimism (reported here), now we are seeing signs of complacency.
The May 8 Profit Radar Report stated the following: “As long as the bullish RSI divergence and support near 2,040 hold, odds favor either a bounce or rally to new recovery highs. We will be watching the open S&P chart gap at 2,079.12. Once/if the gap is closed, we’ll have to determine if this bounce has legs (new recovery highs) or if it is just a small bounce within a deeper correction.”
Barron's rates the iSPYETF as a "trader with a good track record." Click here for Barron's assessment of the Profit Radar Report.
The S&P 500 rallied and closed the open chart gap on Tuesday (May 10). This open gap was our minimum up side target, and the fact that the S&P turned lower immediately after reaching the target indicates persuasive selling pressure.
On the same day, the VIX:VXV ratio dropped to 0.79. Wednesday’s (May 11) Profit Radar Report explained what this means:
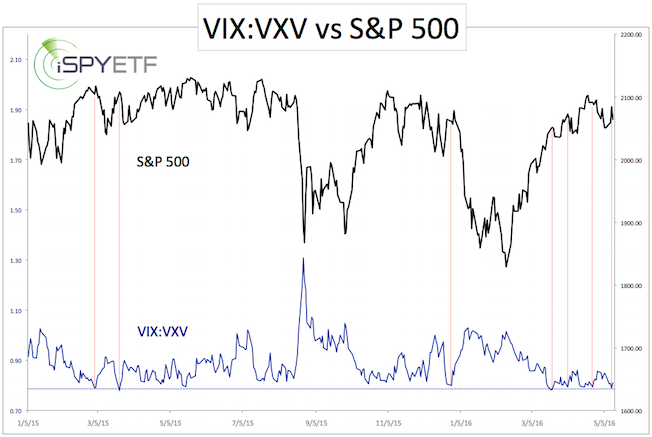
“The chart above plots the S&P 500 against the VIX:VXV ratio. The VIX measures implied volatility for the next 30 days, VXV for the next 90 days. Readings below 1 mean that option traders anticipate 90-day volatility to exceed 30-day volatility. Readings below 0.80 indicate extreme complacency towards short-term volatility. Yesterday’s reading was 0.79.
As the dashed red lines indicate, sub 0.80 readings have consistently led to a pullback, although the scope of any pullback varies. This indicator was the reason we did not want to chase yesterday’s spirited rally.
Today’s S&P 500 reversal after closing the open chart gap yesterday neutralizes (and reverses) the bullish edge discussed on Sunday. The S&P remains in the chop-zone with 2,065 being the likely 'line in the sand' between short-term bullish and bearish moves.
Failure to move back above 2,065 favors further down side. Potential near-term target: below 2,040.”
If you enjoy quality, hand-crafted research, >> Sign up for the FREE iSPYETF Newsletter
Once the S&P reaches the initial down side target, we'll evaluate our dashboard of indicators to see what's next. Continued S&P 500 analysis is available via the Profit Radar Report.
Simon Maierhofer is the founder of iSPYETF and the publisher of the Profit Radar Report. Barron's rated iSPYETF as a "trader with a good track record" (click here for Barron's profile of the Profit Radar Report). The Profit Radar Report presents complex market analysis (S&P 500, Dow Jones, gold, silver, euro and bonds) in an easy format. Technical analysis, sentiment indicators, seasonal patterns and common sense are all wrapped up into two or more easy-to-read weekly updates. All Profit Radar Report recommendations resulted in a 59.51% net gain in 2013, 17.59% in 2014, and 24.52% in 2015.
Follow Simon on Twitter @ iSPYETF or sign up for the FREE iSPYETF Newsletter to get actionable ETF trade ideas delivered for free.

If you enjoy quality, hand-crafted research, >> Sign up for the FREE iSPYETF Newsletter
|
