The recent VIX behavior has been unprecedented.
-
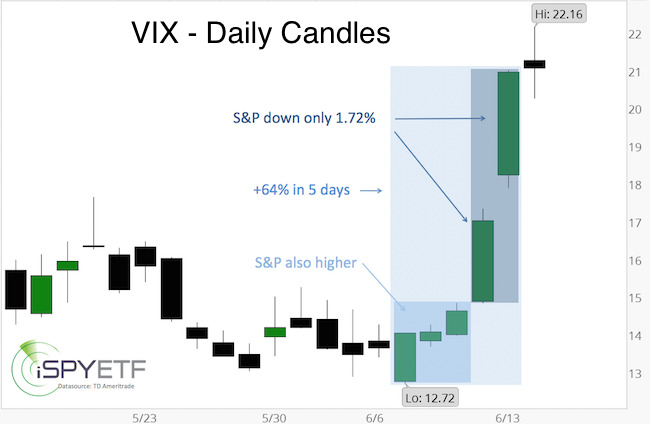
The VIX gained 64% from June 14 – June 20.
-
The VIX gained 41% on June 10 and June 13, while the S&P only lost 1.72%.
-
On June 7, 8, 9, the VIX moved higher along with the S&P 500.
What does this mean?
While the scope of the VIX spike is unprecedented, a higher VIX was to be expected.
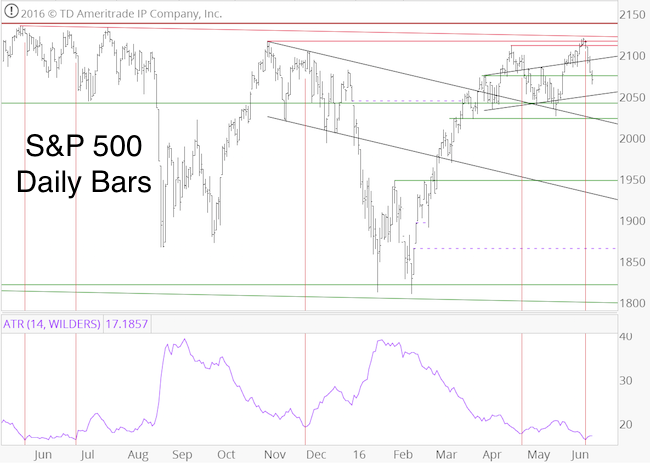
The June 8 Profit Radar Report (S&P 500 closed at 2,119 that day) published the chart below along with the following warning:
“Volatility, as measured by the average true range (ATR), has dropped to the lowest level since June 29, 2015. The chart shows that low ATR, a sign of complacency, tends to be negative for stocks. We will go short the S&P 500 if it drops below 2,110.”
Barron's rates iSPYETF as a "trader with a good track record." Click here for Barron's assessment of the Profit Radar Report.
The next day, the S&P started falling and the VIX starting soaring. On Friday June 10, the VIX spiked 16.33% despite a subdued S&P 500 loss of only 0.92%.
The VIX Spike in Historical Context
What does this discrepancy between VIX and S&P mean? The June 12 Profit Radar Report featured the following analysis:
“Despite a somewhat subdued S&P loss of ‘only’ 0.92%, the VIX spiked 16.33%. This appears excessive, but those kneejerk reactions have almost become the norm as the bull market nears maturity and investors are afraid every decline is the ‘big one.’
The chart (updated chart shown below) plots the S&P 500 against the VIX. The lower panel shows S&P 500 losses and corresponding VIX gains. The dotted red boxes highlight various declines since the beginning of 2014.
The numbers above the red boxes reflect the ratio between VIX gains and S&P losses (i.e. Friday: VIX of 16.33 divided by S&P gain of 0.92 = 17.79) recorded during the first few days of the decline.
Based on this comparison, Friday’s VIX spike, although a potential over reaction, is not necessarily above the norm.”
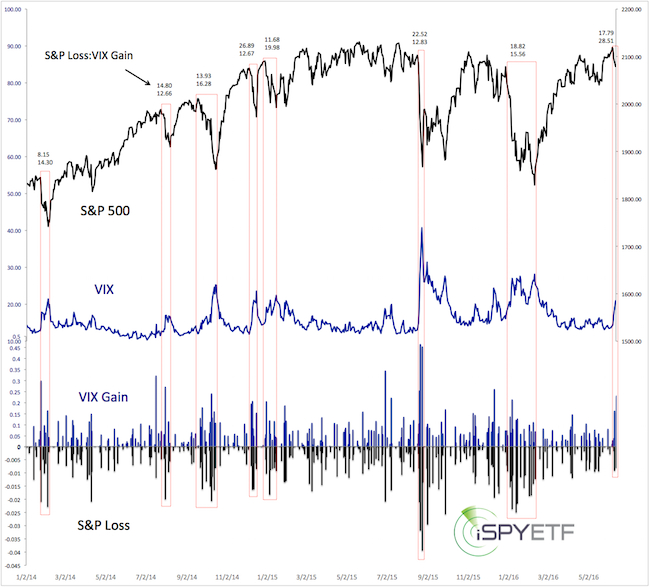
On the next day (June 13), the VIX spiked 23.14% despite another tame S&P loss of only 0.81%. As the updated chart shows, the ratio of 28.51 has become very unusual.
If you enjoy quality, hand-crafted research, >> Sign up for the FREE iSPYETF Newsletter
History suggests that the VIX is due for a mean reversion move (lower). XIV is usually a good vehicle for this mean reversion trade, but it is worth noting that contango tends to turn into backwardation when the VIX sustains trade above 20.
The Profit Radar Report kept it simple and recommended to short the S&P 500 at 2,110.
Continued S&P 500 and VIX analysis is available via the Profit Radar Report.
Simon Maierhofer is the founder of iSPYETF and the publisher of the Profit Radar Report. Barron's rated iSPYETF as a "trader with a good track record" (click here for Barron's profile of the Profit Radar Report). The Profit Radar Report presents complex market analysis (S&P 500, Dow Jones, gold, silver, euro and bonds) in an easy format. Technical analysis, sentiment indicators, seasonal patterns and common sense are all wrapped up into two or more easy-to-read weekly updates. All Profit Radar Report recommendations resulted in a 59.51% net gain in 2013, 17.59% in 2014, and 24.52% in 2015.
Follow Simon on Twitter @ iSPYETF or sign up for the FREE iSPYETF Newsletter to get actionable ETF trade ideas delivered for free.

If you enjoy quality, hand-crafted research, >> Sign up for the FREE iSPYETF Newsletter
|
