Please suffer with me through a somewhat boring but necessary 3-paragraph discussion on VIX vs volatility:
There’s a difference between volatility and VIX volatility. Volatility in general refers to rapid changes. For instance, someone may say: “Volatility will pick up around the Fed announcement."
This may well be true, but increased volatility does not necessarily translate into higher VIX readings.
The VIX measures perceived risk. Perceived risk almost exclusively increases with falling prices. That’s why implied volatility (VIX) is susceptible to directional movement, not movement in general.
A VIX at 16, as the case right now, implies a 16% move (up or down) over the next 12 months (or 4.62% of the next 30 days).
Now we skip from VIX volatility to actual volatility. There are different ways to measure actual volatility; one way is Average True Range (ATR). ATR measures the trading range, in this case daily over 30 days.
Never Miss a Beat! >> Sign up for the FREE iSPYETF e-Newsletter
The chart below plots the S&P 500 against ATR and the VIX. Something unique happened in January/February 2015.
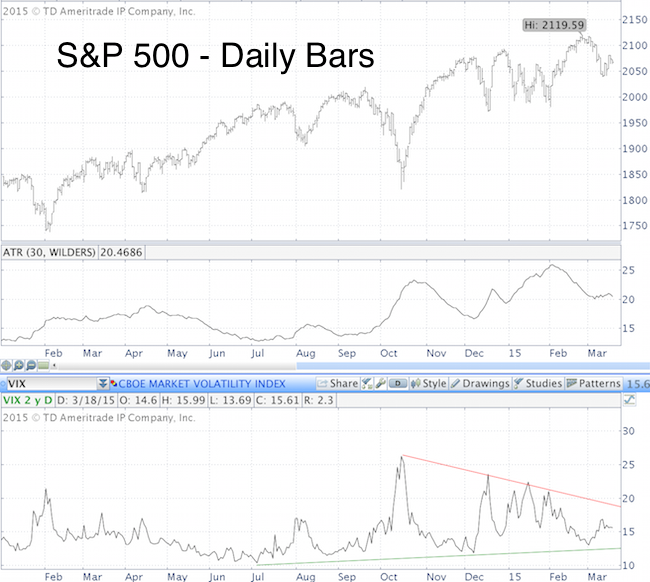
S&P 500 trading got more violent and the ATR soared to 26 points. The VIX on the other hand stayed well below prior highs. In fact, it maintained a string of lower highs.
Is there anything we can learn from this, or is it just a piece of worthless academic research.
I actually think there are two noteworthy takeaways:
-
Investors didn’t overact to the January/February correction. Throughout much of 2013 and 2014 even the smallest corrections (we are talking 5% or less) saw VIX spikes around 50%.
This kind of panic triggers immediate bearish extremes, and limits the down side. The opposite is true for complacent responses. VIX complacency during selloffs allows for more down side and choppier trading activity.
-
As the green trend line shows, the VIX has been sneaking higher, despite an relentless S&P 500 (NYSEArca: SPY) rally. Why is this significant?
Bear markets do not start with the VIX at record lows! Again, bear markets do not start with the VIX at record lows!
Back in July 2014, when the VIX was near 10, I wrote a special report (available to Profit Radar Report subscribers) titled “The VIX is too LOW for a Major Market Top.”
The report pointed out a simple fact that was overlooked by all the experts calling for a market crash (just because the VIX was near 10):
When the S&P 500 peaked in 2000 and 2007, the VIX wasn’t at its low. At the March 2000 high, the VIX was at 22. When the S&P topped in 2007, the VIX was at 16.
Based on the 2000 and 2007 pattern, the slow VIX ascent may actually be a longer-term warning sign.
My reliable ‘ultimate top indicator’ has not triggered a ‘major market top alert’ yet, but the sneaky VIX up trend seems to indicate we are inching closer, certainly closer than we were in the summer of 2014.
Simon Maierhofer is the publisher of the Profit Radar Report. The Profit Radar Report presents complex market analysis (S&P 500, Dow Jones, gold, silver, euro and bonds) in an easy format. Technical analysis, sentiment indicators, seasonal patterns and common sense are all wrapped up into two or more easy-to-read weekly updates. All Profit Radar Report recommendations resulted in a 59.51% net gain in 2013 and 17.59% in 2014.
Follow Simon on Twitter @ iSPYETF or sign up for the FREE iSPYETF Newsletter to get actionable ETF trade ideas delivered for free.

|
