We’ve looked at the VIX/VXV ratio several times in the past. This has been a very helpful and generally accurate indicator.
Here’s how it works:
The VIX (NYSEArca: VXX) reflects how volatile traders expect the next month to be. The VXV reflects how volatile traders expect the next three months to be.
The expectation of increased short-term volatility relative to long-term volatility (VIX/VXV ratio above 1) is usually a contrarian indicator, which means short-term volatility is about to level off and the S&P 500 (NYSEArca: SPY) is about to move higher.
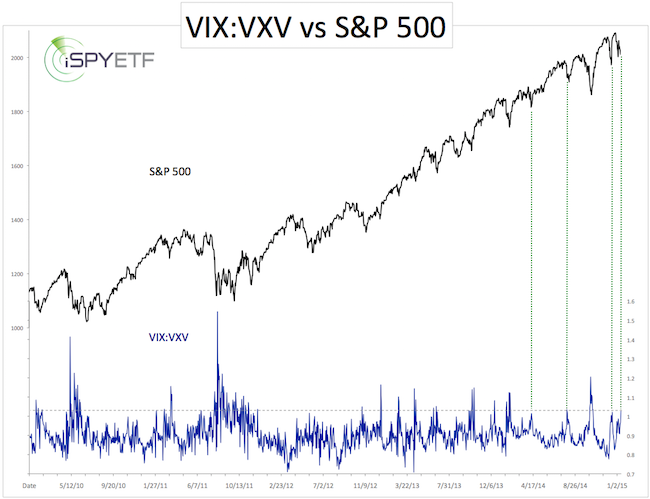
The VIX/VXV ratio popped to 1.03 yesterday. This is the highest reading since October 17.
The green lines show that readings above 1 marked a low 3 out of 4 times.
Right now, this bullish VIX/VXV ratio reading does not jibe with my overall outlook, but it has to be respected to some degree.
Here’s my short-term S&P 500 forecast, which considers the ramification of the VIX/VXV ratio in combination with other indicators.
Short-term S&P 500 Forecast
Simon Maierhofer is the publisher of the Profit Radar Report. The Profit Radar Report presents complex market analysis (S&P 500, Dow Jones, gold, silver, euro and bonds) in an easy format. Technical analysis, sentiment indicators, seasonal patterns and common sense are all wrapped up into two or more easy-to-read weekly updates. All Profit Radar Report recommendations resulted in a 59.51% net gain in 2013.
Follow Simon on Twitter @ iSPYETF or sign up for the FREE iSPYETF Newsletter to get actionable ETF trade ideas delivered for free.

|
