Is the S&P 500 crafting a bear trap or revving up for a 2008-style decline?
A 2008-style meltdown would certainly vindicate many bears. The only problem (for the folks in need of vindication) is that the market likes to humiliate, not vindicate.
Although somewhat anecdotal, this little piece of market psychology is enough to throttle short exposure at this point.
Here is a little less anecdotal and more factual approach to assessing what’s next:
As many of you know, the Profit Radar Report monitors all sorts of market-moving forces (including, but not limited to: supply & demand, investor sentiment, seasonality, and technical analysis).
Sometimes the basic essence (or bottom line) of all this raw data is compressed and presented as one simple projection.
If you enjoy quality, hand-crafted research, >> Sign up for the FREE iSPYETF Newsletter
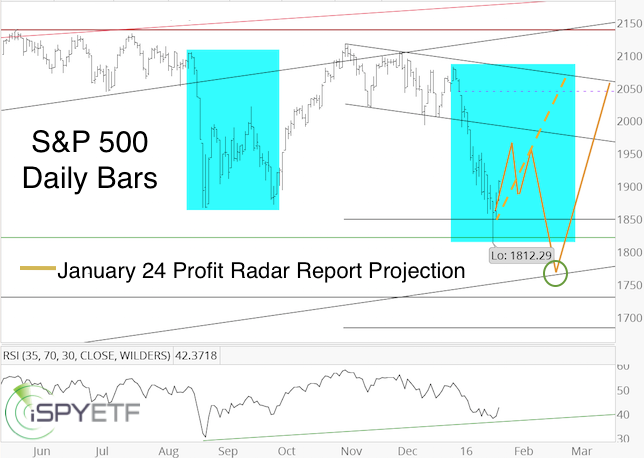
Here is one of those projections featured in the January 13, 24 and many subsequent Profit Radar Report updates. The first chart is the originally published projection.

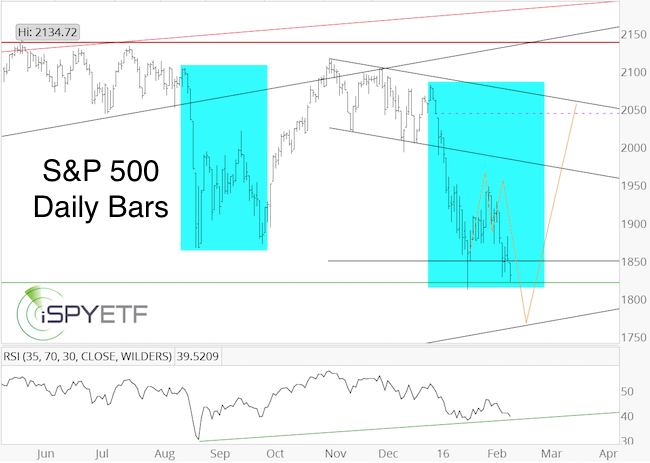
The second chart is an updated version of the same chart/projection.

How did we come up with a choppy multi-week bounce from the January lows towards 1,950 followed by new lows?
It would be to complicated and time consuming to list all the ingredients and methodology behind this projection, but here are three ingredients:
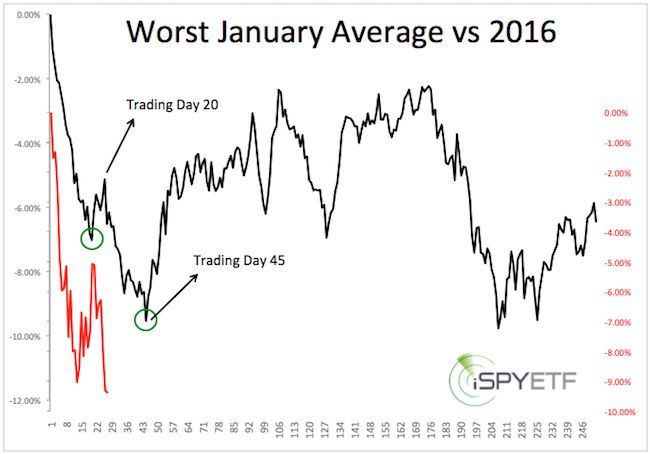
1) January crash anatomy: Since 1970, the S&P 500 lost more than 5% in January eight times. The chart below shows the average performance of those years (1970, 1977, 1978, 1990, 2000, 2008, 2009) in comparison to 2016.

The common denominator was a temporary low after the initial panic decline followed by a bounce and a more sustainable low.
2) Elliott Wave Theory: Crash waves are almost exclusively third waves. Upon completion they are either followed by sizeable rally or a choppy bounce (wave 4) and new lows (wave 5).
The yellow projection basically outlines waves 4 and 5. The last 5-wave corrections happened in 2011 and 2012. Based on the principle of alternation (the stock market rarely delivers the same pattern over and over), a 5-wave decline would make sense (January 24 Profit Radar Report).
3) Lagging small caps: Sunday’s (February 7) Profit Radar Report noted a bearish Russell 2000 formation and a 31-month closing low, and stated this conclusion:
“Odds favor a drop to the next Russell 2000 support levels, which is 955.”
Although the new R2K low is a recent development, it helped confirm the initial projection and the likeliness of new (although temporary) lows.
In summary, although new lows are likely, the odds of an immediate 2008-like decline are slim. This decline looks like a bear trap.
The 2016 S&P 500 Full-Year Forecast has just been published, and continued updates are available to subscribers of the Profit Radar Report.
Simon Maierhofer is the publisher of the Profit Radar Report. The Profit Radar Report presents complex market analysis (S&P 500, Dow Jones, gold, silver, euro and bonds) in an easy format. Technical analysis, sentiment indicators, seasonal patterns and common sense are all wrapped up into two or more easy-to-read weekly updates. All Profit Radar Report recommendations resulted in a 59.51% net gain in 2013, 17.59% in 2014, and 24.52% in 2015.
Follow Simon on Twitter @ iSPYETF or sign up for the FREE iSPYETF Newsletter to get actionable ETF trade ideas delivered for free.

If you enjoy quality, hand-crafted research, >> Sign up for the FREE iSPYETF Newsletter
|