Wall Street is ridden with misconceptions. One of the most proliferated fairy tails is that historically low VIX readings are precursors of major stock market tops (that's what we were told in 2014 and early 2017 when the VIX traded close to 10).
True, the VIX acts as a contrarian indicator at times, but it fails miserably when used as a major market top indicator.
The research below was initially published by the Profit Radar Report on June 16, 2014.
Barron's rates iSPYETF as "trader with a good track record" and Investor's Bussines Daily says "When Simon says, the market listens." Find out why Barron's and IBD endorse Simon Maierhofer's Profit Radar Report.
* * * * * June 16, 2014 Profit Radar Report: The VIX is too LOW for a Major Market Top * * * * *
Financial Advisor Magazine just published an article titled “Black Swans Love a Low VIX.” Surely if an industry magazine advising financial advisors implies a VIX induced ‘Black Swan’ event, it must be true.
Along the same lines, the Financial Times reports, in a piece titled “Financial markets: Hurrah Before the Storm,” that: “The VIX index is near seven-year lows. Like sailors sensing a lull before the next storm, some industry veterans warn of possible trouble ahead.”
Facts vs. Conventional Wall Street Wisdom
Conventional Wall Street wisdom suggests that extremely low VIX readings precede major market tops, but the facts disagree.
The last two major stock market tops did not coincide with low VIX readings.
Figure 1 offers a long-term comparison between the S&P 500 and the VIX. The dashed red lines mark the March 2000 and October 2007 tops.
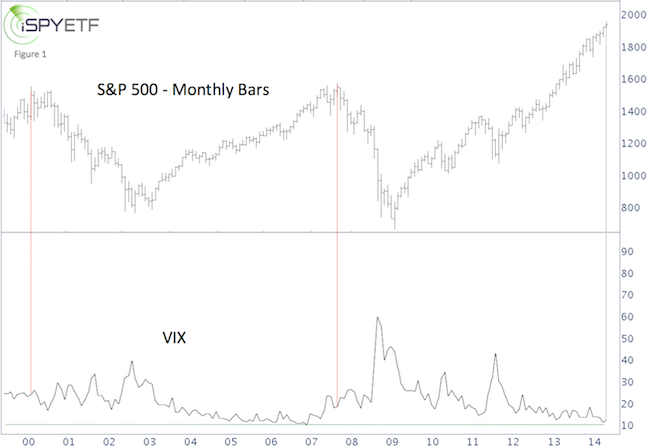
Figure 2 provides more details on the 2000 high. The S&P 500 recorded top tick at 1,552.87 on March 24. The VIX traded at 22.12 that day.
If you enjoy quality, hand-crafted research, >> Sign up for the FREE iSPYETF Newsletter
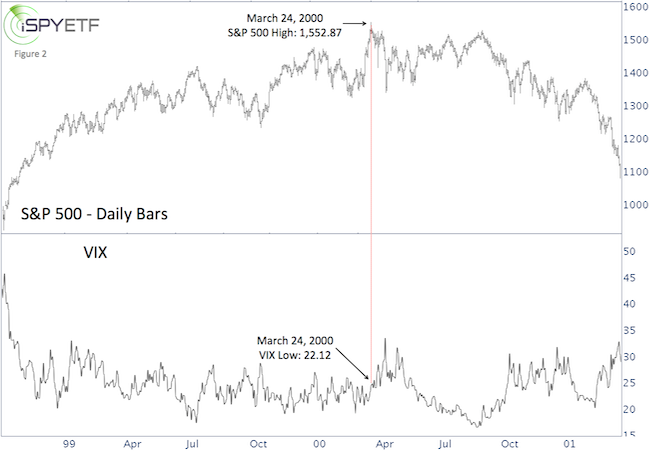
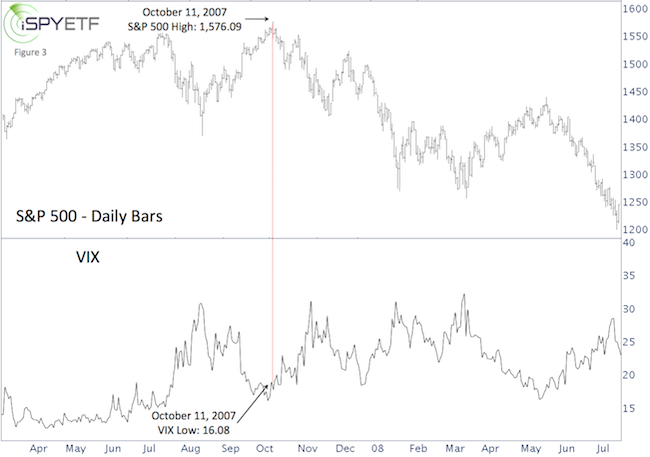
Figure 3 zooms in on the 2007 top. The S&P 500 peaked on October 11 at 1,576.09. The VIX traded as low as 16.08 that day.
On June 6, 2014, the VIX dipped to 10.73, the lowest level since February 26, 2007. This may represent a certain degree of complacency, but based on historic patterns it's not a signal for a major top.
* * * * * June 16, 2014 Profit Radar Report: The VIX is too LOW for a Major Market Top * * * * *
If you enjoy quality, hand-crafted research, >> Sign up for the FREE iSPYETF Newsletter
At the most recent all-time (March 1), the S&P 500 traded as high as 2,400.98. The VIX closed at 12.54 that day, and traded as low as 9.97 a month earlier. Based on the historic patterns discussed above, 2,400.98 did not mark an all-time high.
The VIX is subject to very pronounced and distinct seasonal forces, with one major seasonal top, and one major seasonal bottom. The VIX seasonality chart (available to subscribers of the Profit Radar Report) is a powerful tool for spotting significant VIX highs and lows.
Simon Maierhofer is the founder of iSPYETF and the publisher of the Profit Radar Report. Barron's rated iSPYETF as a "trader with a good track record" (click here for Barron's profile of the Profit Radar Report). The Profit Radar Report presents complex market analysis (S&P 500, Dow Jones, gold, silver, euro and bonds) in an easy format. Technical analysis, sentiment indicators, seasonal patterns and common sense are all wrapped up into two or more easy-to-read weekly updates. All Profit Radar Report recommendations resulted in a 59.51% net gain in 2013, 17.59% in 2014, and 24.52% in 2015.
Follow Simon on Twitter @ iSPYETF or sign up for the FREE iSPYETF Newsletter to get actionable ETF trade ideas delivered for free.

If you enjoy quality, hand-crafted research, >> Sign up for the FREE iSPYETF Newsletter
|
