Subscribers to iSPYETF’s free e-mail newsletter receive a market outlook, usually once a week. The market outlook below was sent out on August 19, 2021. If you’d like to sign up for the free e-newsletter, you may do so here (we will never share your e-mail with anyone, just as we don't accept advertising).
The stock market has coughed up some epic divergences and curious internals lately. First we'll look at what we're seeing and then at what it means.
- At the last 3 S&P 500 all-time highs (Aug. 12, 13, 16), less than 50% of NYSE-traded stocks advanced and less than 50% of trading volume went into advancing stocks. This happened 11 other times (since 2009).
- The cumulative NYSE advance/decline line has failed to confirm S&P highs since July 6. With 32 consecutive days, that's the longest divergence since July 2014 (see chart below).
- There's never been a bigger spread between Nasdaq-100 and Nasdaq Composite components trading above their 50-day SMA (in August, as high as 73% for the Nasdaq-100 and as low as 31% for the Nasdaq Composite).
- Yesterday, the VIX soared 20.44% even though the S&P dipped only 1.07%. This happened only 6 other times since 2009.

Usually when there's a big VIX spike knee-jerk reaction, it's a positive for stocks (almost like a flush out the weak hands event). This time, the figures tell a different story.
The chart below shows every time the VIX spiked more than 20% on a day the S&P dipped less than 1.10% (there were 7 total signal dates). A quick glance reveals that 5 of 6 signals preceded some pretty rough markets.
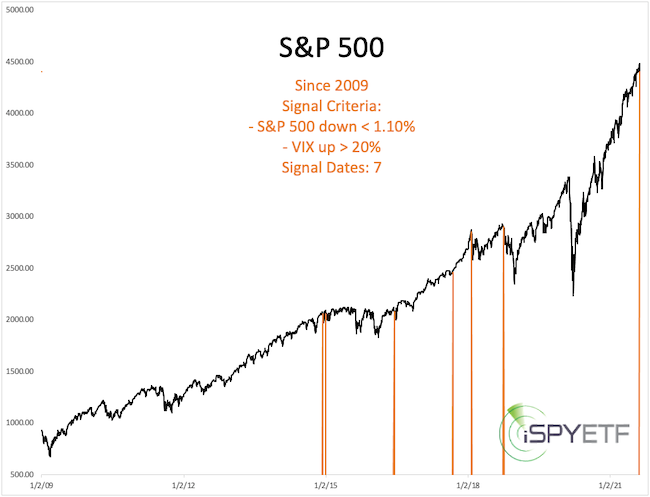
Yesterday, the VIX soared 20.44% even though the S&P dipped only 1.07%. This happened only 6 other times since 2009.
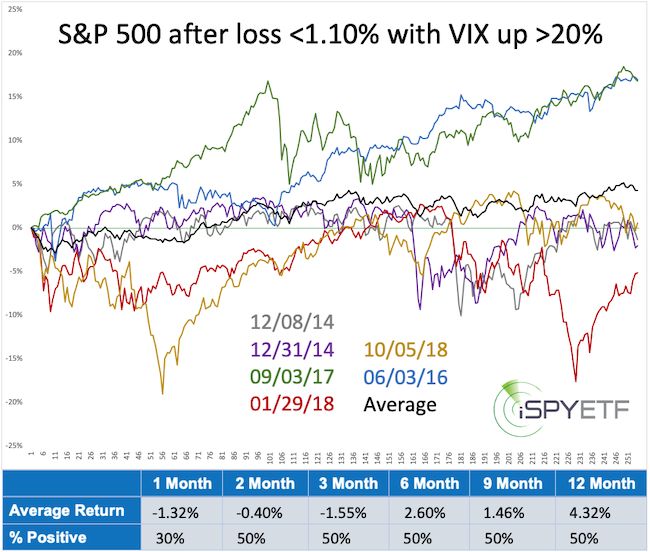
The chart below shows S&P 500 forward performance after each signal date. Two things jump out:
- Forward returns were anemic.
- Odds of positive returns were only 50% for the first 6 months.
Those are dismal return figures considering that the signals occurred during one of the strongest bull markets in history.
Needless to say, there's a lot of activity under the stock market hood and I've seen the media coming to misleading conclusions without checking the facts.
The Profit Radar Report always looks at the facts. Recent updates identify other times when similar conditions existed (i.e. 3 consecutive all-time highs with less than 50% participation, NYSE a/d line divergences lasting longer than 9 days, Nasdaq-100 vs Nasdaq Composite spread) and how the S&P 500 performed thereafter.
The stock market is unprecedented as it is, but there is no excuse for at least getting our facts straight and make fact-based decisions.
Short-term, as brought out in last night's Profit Radar Report, the S&P 500 ended yesterday over-sold (dashed gray lines, chart above), which marked the last 3 pullback lows.
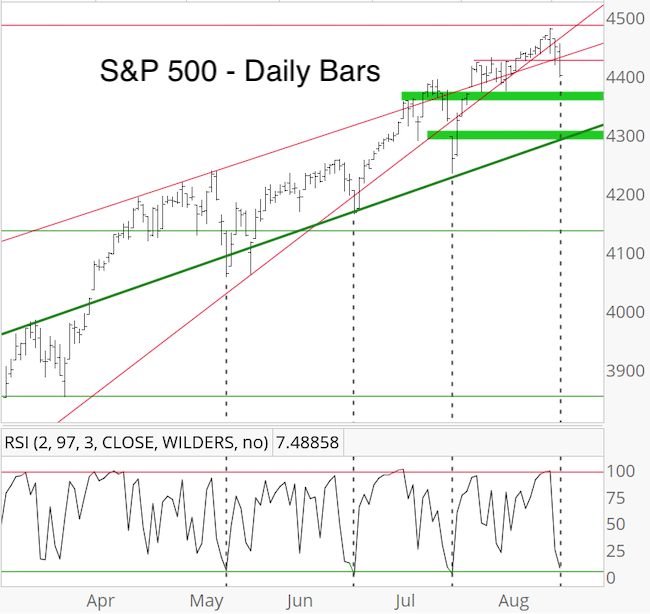
Failure to get above resistance (red lines) and progress to the down side would suggest this pullback has more bite than prior ones.
My Risk/Reward Heat Map (more info available here if you are not familiar) shows elevated risk for August/September.
Continued updates, out-of-the box analysis and forward performance based on historic precedents are available via the Profit Radar Report.
The Profit Radar Report comes with a 30-day money back guarantee, but fair warning: 90% of users stay on beyond 30 days.
Barron's rates iSPYETF a "trader with a good track record," and Investor's Business Daily writes "Simon says and the market is playing along."
|
