There’s never been a time when articles on iSPYETF.com have been posted at the snail-pace of about one per month … until now.
Unless you are a stock picker, there’s simply been nothing worthwhile to write about.
The October 1 Profit Radar Report warned of just such a period of inactivity:
“The bullish Elliott Wave Theory count would see stocks grind higher for a number of weeks in a 2 steps forward, 1 step back pattern. A real unexciting, unstimulating and uninspiring grind higher to 2,600+/-. Unless the S&P drops below 2,500, this is now the most likely outcome.”
Barron's rates iSPYETF as "trader with a good track record" and Investor's Bussines Daily says "When Simon says, the market listens." Find out why Barron's and IBD endorse Simon Maierhofer's Profit Radar Report.
This ‘real unexciting, unstimulating and uninspiring grind higher to 2,600+/-‘ has already lasted more than 7 weeks.
The Clearest Chart Right Now
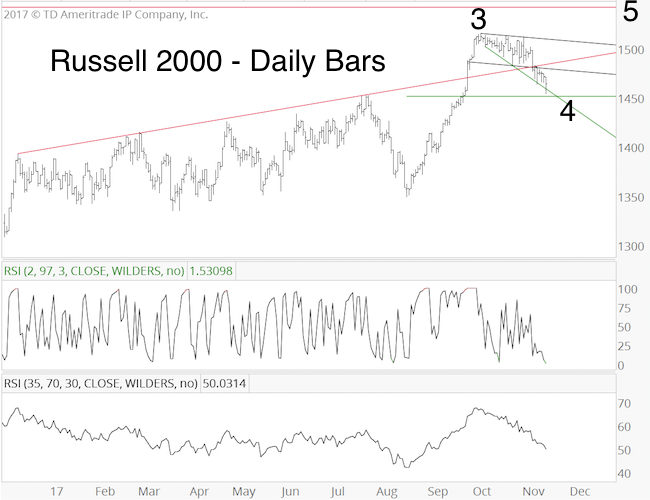
One of the best tell-tale since during this 7-week period came from the Russell 2000. The chart and commentary below were published in the November 15 Profit Radar Report:
“The Russell 2000 is leaking lower. RSI-2 is now oversold with support around 1,452. The correction since the October 5 high looks like a wave 4. The 38.2% Fibonacci retracement level (a common target for waves 4) is at 1,451.35 (just 3 points below today’s low). The R2K appears to be nearing a bounce, there’s even a possibility today’s low was a more sizeable low.”
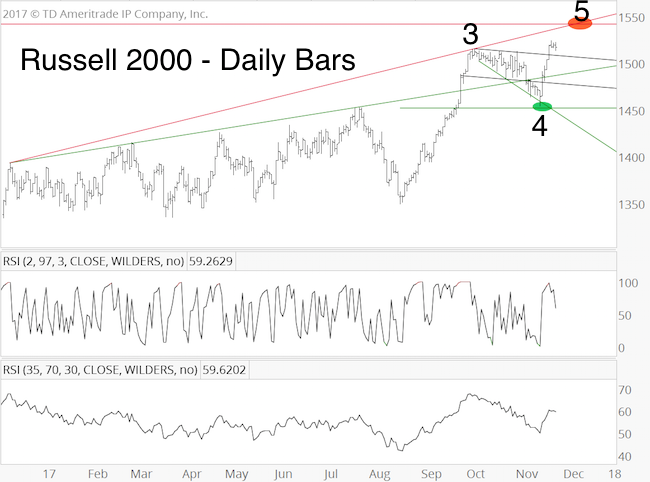
Below is an updated Russell 2000 chart. Trade touched support around 1,450 on November 15, and rallied strongly. The minimum requirement for wave 5 is to reach new highs (which it already did), but the convergence of resistance levels around 1,542 (red oval) is the next most logical up side target (higher is also possible).
If you enjoy quality, hand-crafted research, >> Sign up for the FREE iSPYETF Newsletter
S&P 500 Update
The S&P 500 has basically reached the 2,600+/- up side target mentioned October 1. The post-Thanksgiving week is seasonally weak, but as long as trade stays above 2,590, the S&P is likely to move towards the next resistance cluster around 2,650 (the 1-4 week outlook featured in the November 19 Profit Radar Report stated that we: "anticipate a move into the mid 2,600s").
Continued analysis for the S&P 500, Russell 2000, gold, silver, euro, dollar and other equity indexes is provided via the Profit Radar Report.
Simon Maierhofer is the founder of iSPYETF and the publisher of the Profit Radar Report. Barron's rated iSPYETF as a "trader with a good track record" (click here for Barron's profile of the Profit Radar Report). The Profit Radar Report presents complex market analysis (S&P 500, Dow Jones, gold, silver, euro and bonds) in an easy format. Technical analysis, sentiment indicators, seasonal patterns and common sense are all wrapped up into two or more easy-to-read weekly updates. All Profit Radar Report recommendations resulted in a 59.51% net gain in 2013, 17.59% in 2014, and 24.52% in 2015.
Follow Simon on Twitter @ iSPYETF or sign up for the FREE iSPYETF Newsletter to get actionable ETF trade ideas delivered for free.

If you enjoy quality, hand-crafted research, >> Sign up for the FREE iSPYETF Newsletter
|
