A watched pot doesn’t boil and a ‘watched’ market doesn’t crash.
Are investors watching signs for an impending market crash? It seems like they are.
Today and 1929
In February, charts like this one published by The Atlantic under the headline “That Viral Chart Predicting Another 1929 Stock-Market Crash?” made their rounds.
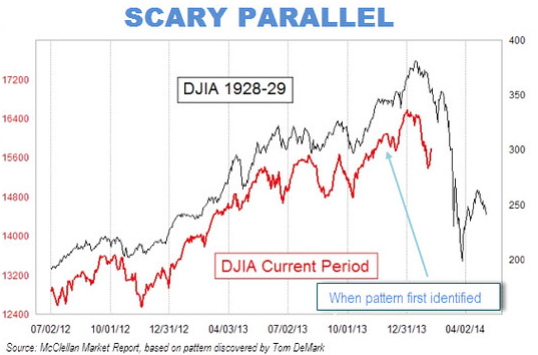
The chart compares the Dow Jones Industrial of the late 1920s with the Dow Jones of the early 2010s.
Today and 1987
Today, the S&P 500 chart shown below is stoking people’s imagination. It was published by USA Today under the headline “Is a 1987-type Market Crash 37 Days Away?”
Admittedly, articles like the ones mentioned above are anecdotal in nature, but they are published because that’s what people want to read right now (Barron’s just asked again: “Bubble or No Bubble”).
Just because it’s anecdotal doesn’t mean it's garbage. Back in 2013, the March 10 Profit Radar Report looked at the Dow’s new all-time high and observed the following:
“The Dow surpassed its 2007 high and set a new all-time high last week, but investors seem to embrace this rally only begrudgingly and the media is quick to point out the ‘elephant in the room’ – stocks are only up because of the Fed. Below are a few of last week’s headlines:
CNBC: Dow Breaks Record, but Party Unlikely to Last
Washington Post: Dow Hits Record High as Markets are Undaunted by Tepid Economic Growth, Political Gridlock
The Atlantic: This is America, Now: The Dow Hits a Record High with Household Income at a Decade Low
CNNMoney: Dow Record? Who Cares? Economy Still Stinks
Reuters: Dow Surges to New Closing High on Economy, Fed’s Help
We know this is a phony rally, but so does everyone else. We know this will probably end badly eventually, but so does everyone else. The market likes to fool as many as possible and it seems that overall further gains would befuddle the greater number.”
Once every month the Profit Radar Report takes a detailed look at investor sentiment (this report is called the ‘Sentiment Picture’). The Sentiment Picture plots various sentiment gauges against the S&P 500 (SNP: ^GSPC) to illustrate how current extremes (if there are any) affected the S&P 500 in the past.
This comprehensive look at sentiment raised two red flags in 2013. One in May and one in December, when the Sentiment Picture warned that: “Bullish sentiment will catch up with stocks in January. This should cause a deeper, but also temporary correction.”
The correction came in January/February and basically reset investor sentiment.
Current Sentiment Reading
Although the S&P 500 (NYSEArca: SPY) is back near all-time highs, investor sentiment isn’t. The chart below, courtesy of the March 20, 2014 Sentiment Picture, illustrates sentiment.
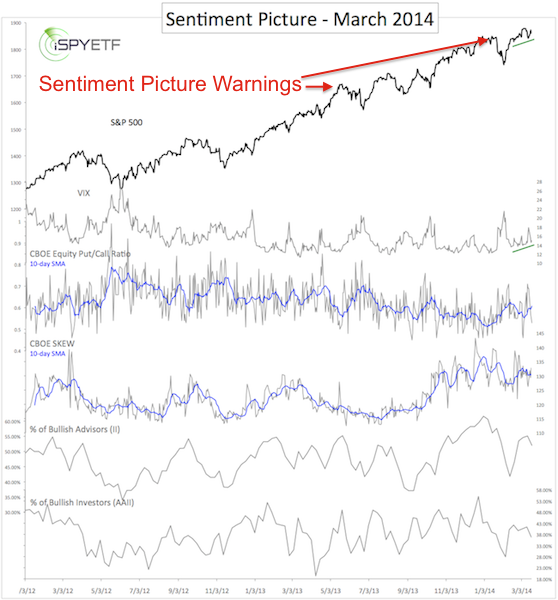
There are no real extremes, which means there are enough potential buyers out there that could drive prices higher.
The lack of sentiment extremes doesn’t mean stocks must move higher. In fact, seasonality is soon turning bearish and the S&P 500 is butting against key long-term resistance.
The S&P 500 has peeled away from this resistance several times. Obviously if the S&P thinks this resistance important, so should we (to clarify the article's headline: If you you think the market will crash and want to buy stocks, or if you just want to buy stocks, wait until the S&P 500 moves above this resistance).
Here are two charts that illustrates the S&P’s most respected resistance (warning: the charts will probably change the way you look at the S&P 500):
S&P 500 – Stuck Between Triple Top and Triple Bottom – What’s Next?
Simon Maierhofer is the publisher of the Profit Radar Report. The Profit Radar Report presents complex market analysis (S&P 500, Dow Jones, gold, silver, euro and bonds) in an easy format. Technical analysis, sentiment indicators, seasonal patterns and common sense are all wrapped up into two or more easy-to-read weekly updates. All Profit Radar Report recommendations resulted in a 59.51% net gain in 2013.
Follow Simon on Twitter @ iSPYETF or sign up for the FREE iSPYETF Newsletter to get actionable ETF trade ideas delivered for free.

|
