The ‘death cross’ has struck again, demanding the next ‘casualty,’ the S&P 500.
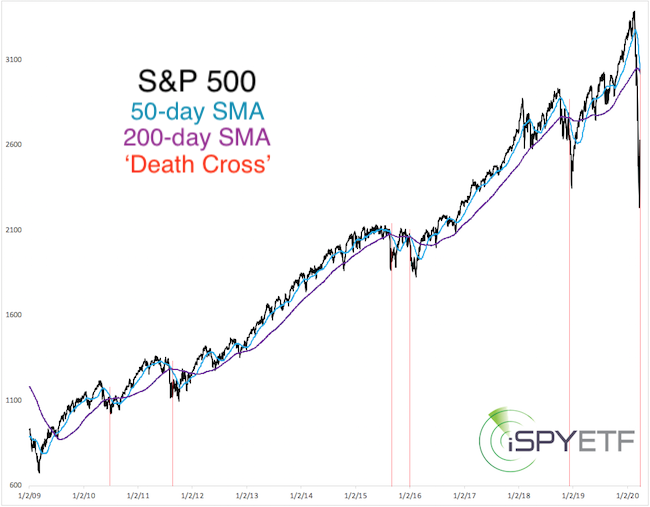
Yesterday, the S&P 500’s 50-day SMA crossed below the 200-day SMA, commonly - and ominously - considered the ‘death cross.’
Something with such a dire name has got to be bearish, right?
There were 5 other S&P 500 death crosses in the last decade (red lines, chart below). None of them was particularly bearish. But, all of those happened during one of the greatest bull markets of all time.
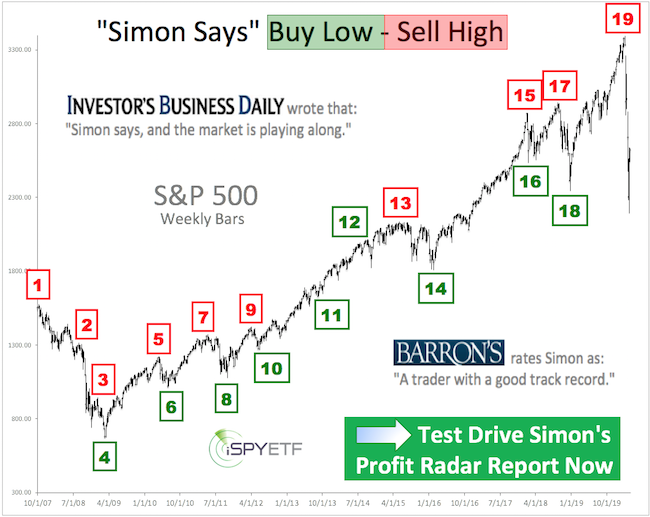
Barron's rates iSPYETF as "trader with a good track record" and Investor's Business Daily says: "When Simon says, the market listens." Find out why Barron's and IBD endorse Simon Maierhofer's Profit Radar Report.
Let’s expand the look-back period to 50 years and apply the following two filters to get the most similar precedents:
-
First crossover (50-day SMA below 200-day SMA) in at least 10 months
-
Crossover preceded by a 5% decline over the prior 4 weeks
Here are the signals: 2/1984, 11/1987, 4/1994, 7/2010, 8/2011, 8/2015, 12/2018.
The chart below shows the performance of each signal 40 trading days before the crossover and 250 trading days (1 year) thereafter.
If you enjoy quality, hand-crafted research, sign up for the FREE iSPYETF e-newsletter & market outlook
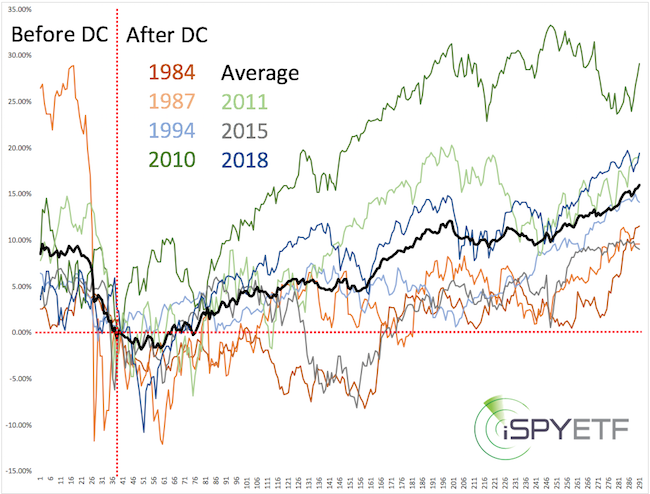
Short-term, the performance was rocky, but long-term performance was solid:
-
1 month later: S&P 500 down 5 of 7 times (average loss: 1.47%)
-
2 month later: S&P 500 up 6 of 7 times (average gain: 2.29%)
-
3 month later: S&P 500 up 7 of 7 times (average gain: 4.58)
-
6 month later: S&P 500 up 6 of 7 times (average gain: 7.00%)
-
12 month later: S&P 500 up 7 of 7 times (average gain: 16.06%)
The chart below shows the S&P 500 performance for the past 40 days and the average forward performance of the past 7 signals projected forward.
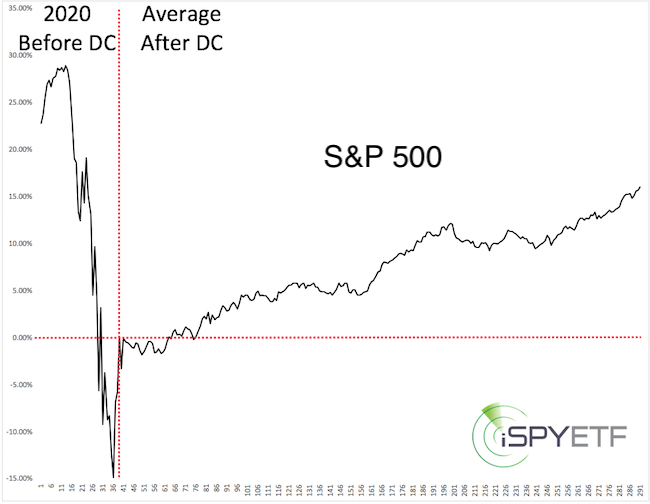
Based on the past 50 years of history, the death cross has not been a bearish signal. The caveat is that the 2020 stock market has already defied many historic patterns.
Some of those historic extremes along with the short-term S&P 500 forecast are available here.
Continued updates, projections, buy/sell recommendations are available via the Profit Radar Report.
Simon Maierhofer is the founder of iSPYETF and the publisher of the Profit Radar Report. Barron's rated iSPYETF as a "trader with a good track record" (click here for Barron's evaluation of the Profit Radar Report). The Profit Radar Report presents complex market analysis (S&P 500, Dow Jones, gold, silver, euro and bonds) in an easy format. Technical analysis, sentiment indicators, seasonal patterns and common sense are all wrapped up into two or more easy-to-read weekly updates. All Profit Radar Report recommendations resulted in a 59.51% net gain in 2013, 17.59% in 2014, 24.52% in 2015, 52.26% in 2016, and 23.39% in 2017.
|