The February 8, 2018 Profit Radar Report published the following chart and commentary:
“The S&P 500 moved from the yellow zone into the green buy. Does that mean it’s time to buy? It depends on the time frame. Short-term, potentially yes. The hourly chart shows a 5-wave decline into today’s low. A completed 5-wave move, according to Elliott Wave Theory, generally projects a bounce followed by another leg lower. There were many extended fifth waves on the way up, so there is a distinct possibility that there will be extended fifth waves on the way down.”
Barron's rates iSPYETF as "trader with a good track record" and Investor's Business Daily says: "When Simon says, the market listens." Find out why Barron's and IBD endorse Simon Maierhofer's Profit Radar Report.
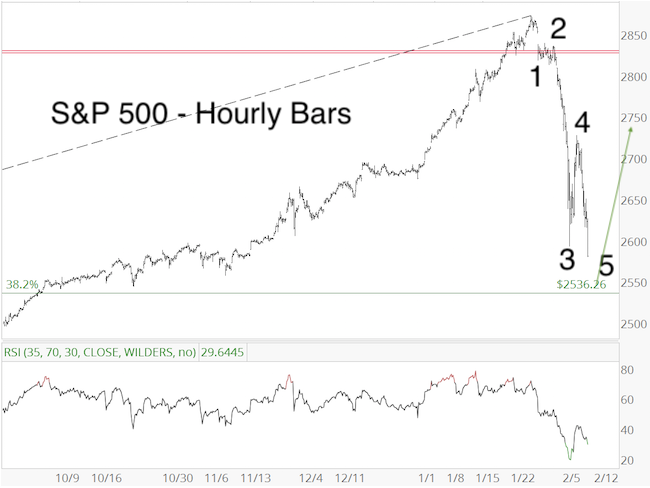
As it turns out, wave 5 did extend lower and hit the wave 5 target projected on the chart the next day.
As mentioned in the February 8 commentary, a 5-wave decline is generally followed by another leg lower. However, the rally from the February 9 low at 2,532.69 is not clearly corrective.
New Highs or Relapse
The chart below identifies the next key levels to watch. Corrective rallies tend to retrace no more than 61.8% of the prior decline. The 61.8% resistance level for the S&P 500 is at 2,743. Red trend line resistance (going back to April 2016) is at 2,723.
If you enjoy quality, hand-crafted research, >> Sign up for the FREE iSPYETF Newsletter
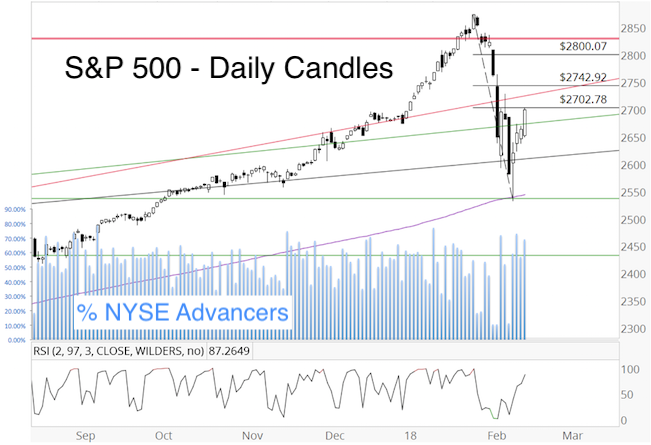
Thus far, the rally from the February 9 low has been strong in terms of price (170+ points in 4 days), but not necessarily breadth. As the lower graph shows, the percentage of advancing NYSE stocks barely exceeded 70 the last week.
That’s not weak per say, but also not unequivocally strong. A day or two of 80%+ readings would have been more indicative of a sustainable rally.
In short, how the S&P reacts to the 2,723 – 2,743 resistance cluster should provided clues about whether stocks will relapse to test their panic lows or move toward new all-time highs.
Continued updates are provided via the Profit Radar Report.
Simon Maierhofer is the founder of iSPYETF and the publisher of the Profit Radar Report. Barron's rated iSPYETF as a "trader with a good track record" (click here for Barron's profile of the Profit Radar Report). The Profit Radar Report presents complex market analysis (S&P 500, Dow Jones, gold, silver, euro and bonds) in an easy format. Technical analysis, sentiment indicators, seasonal patterns and common sense are all wrapped up into two or more easy-to-read weekly updates. All Profit Radar Report recommendations resulted in a 59.51% net gain in 2013, 17.59% in 2014, and 24.52% in 2015.
Follow Simon on Twitter @ iSPYETF or sign up for the FREE iSPYETF Newsletter to get actionable ETF trade ideas delivered for free.
If you enjoy quality, hand-crafted research, >> Sign up for the FREE iSPYETF Newsletter
|
