The S&P 500 reached our minimum down side target and rallied strongly. Is this rally for real or are stocks just ‘churning for another burning’?
Bullish Signals
This week’s rally is credited to the French election, but a series of solid buy signals triggered days before the news from France.
The CBOE equity put/call ratio signaled a S&P 500 rally.
Contango and the VIX/VXV ratio signal a VIX decline.
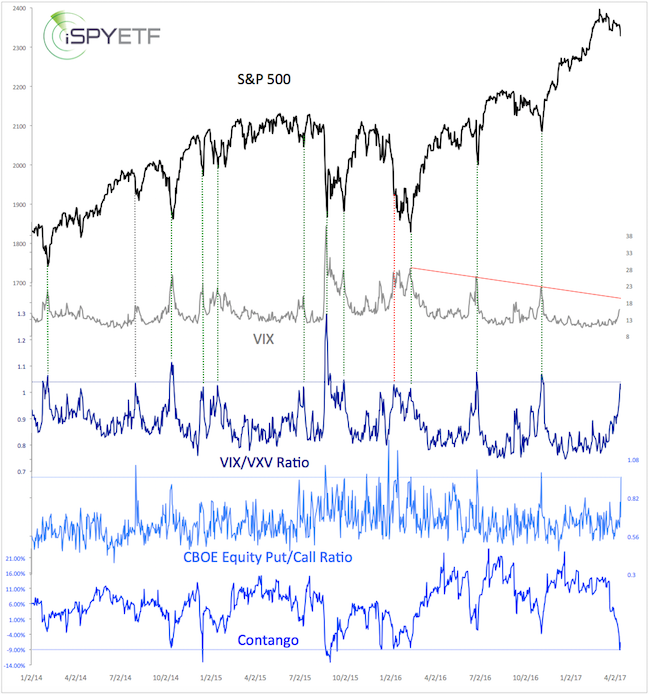
The chart below - which plots the S&P 500 against the VIX, VIX/VXV ratio, CBOE equity put/call ratio, and contango – was published in the April 16 PRR along with the following commentary:
“The VIX/VXV ratio, equity put/call ratio and contango are at multi-month extremes. It appears like the amount of sellers left (needed to drive prices lower) is rather limited. The weight of evidence strongly suggests that we should focus on the upcoming buying opportunity, not on how much more down side may or may not be left.”
Barron's rates iSPYETF as "trader with a good track record" and Investor's Bussines Daily says "When Simon says, the market listens." Find out why Barron's and IBD endorse Simon Maierhofer's Profit Radar Report.
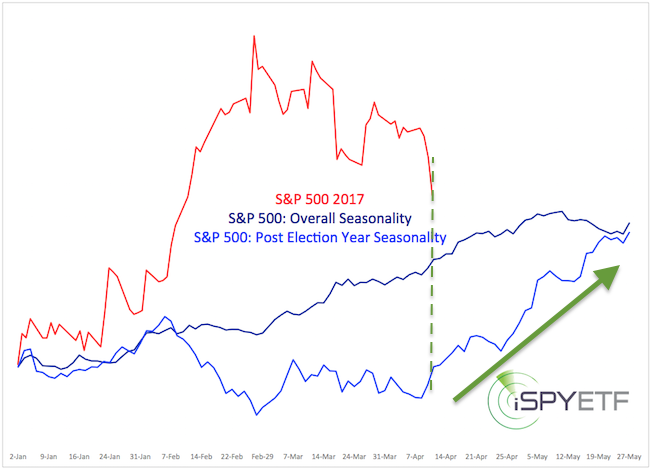
The same Profit Radar Report also highlighted positive seasonality (see below).
Bearish Caveat
This bounce is in sync with seasonality and various buy signals, but will it last?
If you enjoy quality, hand-crafted research, >> Sign up for the FREE iSPYETF Newsletter
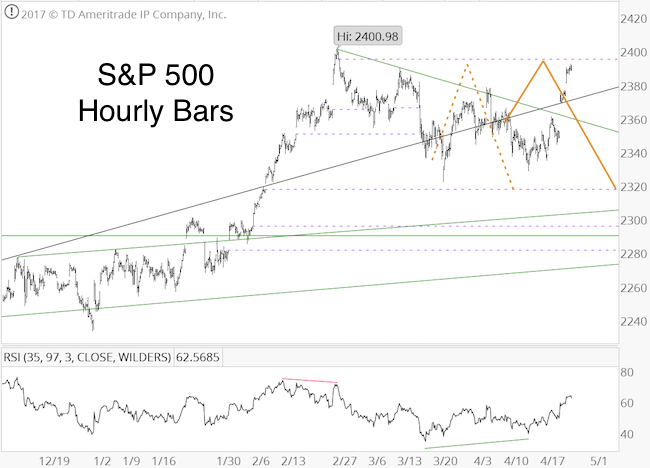
The April 9 PRR featured the yellow projection shown below. According to this scenario (based on Elliott Wave Theory), the S&P would reverse above 2,390 and fall to new lows (2,320 or below).
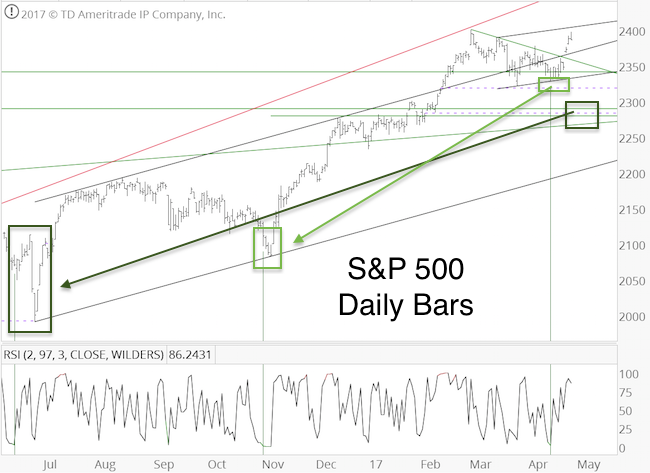
The April 16 PRR also featured the chart below, which highlights deeply oversold conditions (bottom graph, green lines). In November 2016, a deeply oversold condition led to an almost immediate bounce. In June 2016, the deeply oversold condition was followed by a 63-point rally and subsequent relapse.
It appears like the S&P 500 has encountered a 'fork in the road.' The reaction above 2,390 should tell us whether we'll see a relapse or continued gains.
We will be watching various breadth, money flow, sentiment and technical indicators to determine whether this rally will stop here or not.
Continuous updates are available via the Profit Radar Report.
Simon Maierhofer is the founder of iSPYETF and the publisher of the Profit Radar Report. Barron's rated iSPYETF as a "trader with a good track record" (click here for Barron's profile of the Profit Radar Report). The Profit Radar Report presents complex market analysis (S&P 500, Dow Jones, gold, silver, euro and bonds) in an easy format. Technical analysis, sentiment indicators, seasonal patterns and common sense are all wrapped up into two or more easy-to-read weekly updates. All Profit Radar Report recommendations resulted in a 59.51% net gain in 2013, 17.59% in 2014, and 24.52% in 2015.
Follow Simon on Twitter @ iSPYETF or sign up for the FREE iSPYETF Newsletter to get actionable ETF trade ideas delivered for free.

If you enjoy quality, hand-crafted research, >> Sign up for the FREE iSPYETF Newsletter
|
