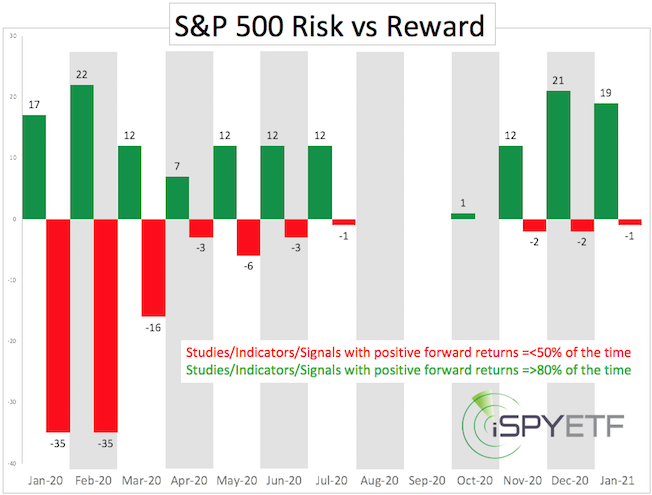
The last S&P 500 update introduced the risk/reward heat map (RRHM), which projected increased risk in January/February (see image below). How exactly the RRHM is produced is discussed here: Risk Reward Heat Map Methodology
The January 15 Profit Radar Report warned that: “Based on our risk/reward heat map, we are approaching a period of increased risk with an initial emphasis on late January.”
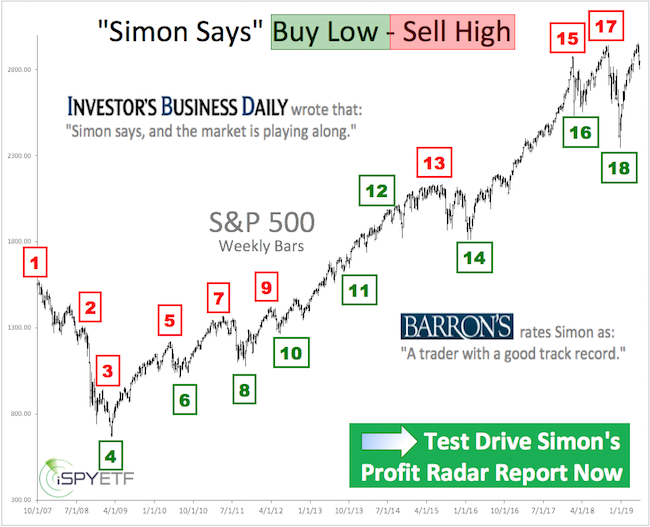
Barron's rates iSPYETF as "trader with a good track record" and Investor's Business Daily says: "When Simon says, the market listens." Find out why Barron's and IBD endorse Simon Maierhofer's Profit Radar Report.
Just 4 days later, stocks suffered the biggest pullback since October 2019.
The pullback stopped on February 3, which makes the analysis from the February 2 Profit Radar Report (republished below) all the more interesting:
* * * * * February 3, Profit Radar Report * * * * *
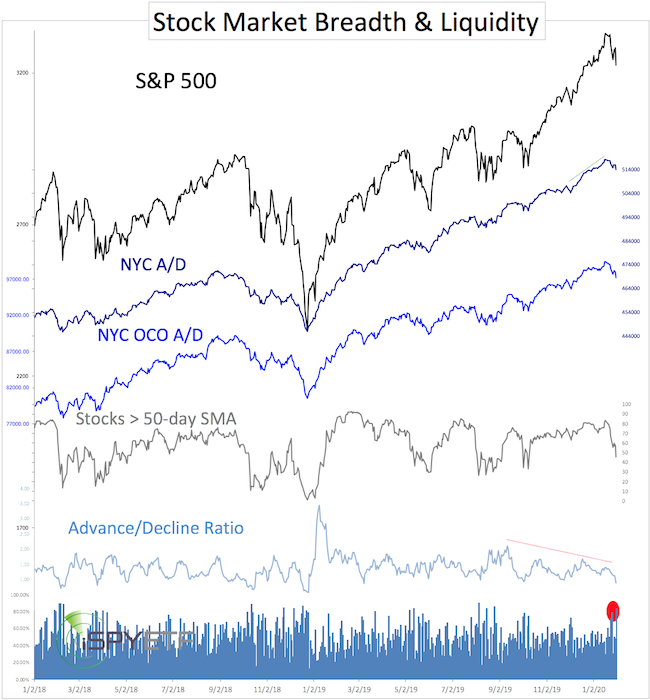
“Based on preliminary data, 82.85% of NYSE-traded stocks ended Friday lower, the biggest down day since August 8, 2019. The chart below shows various breadth gauges. The bottom graph reflects down days. A cluster of down days (80% or 90%) tends to reflect selling exhaustion and is usually seen near bottoms, so we’ll be keeping an eye on that.
We’ve seen two 80%+/- down days already, so one could argue there’s already a measure of exhaustion.
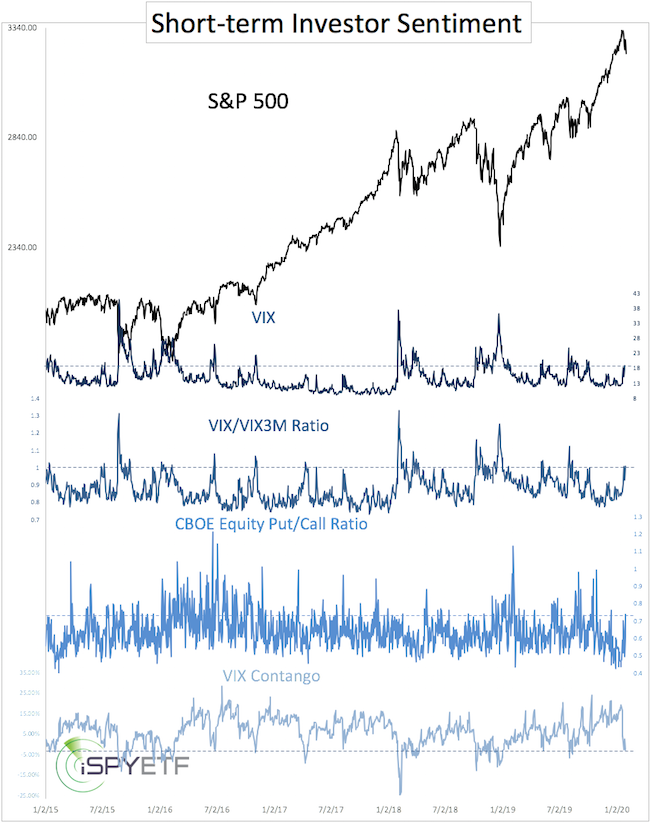
Almost all of our short-term sentiment gauges perked up nicely and are already showing minor extremes. In times past, readings of similar degree have been enough to mark a bottom. Since we’ve seen some significant optimism extremes at the top, it is quite possible we need some more significant pessimism extremes. This, however, is not required.
If you enjoy quality, hand-crafted research, >> sign up for the FREE iSPYETF e-newsletter & market outlook
The S&P 500 closed right on the green support trend line, which could be considered the minimum down side target for this pullback. Due to the sentiment extremes at the top and our RRHM, we would like to see lower prices, with 3,190 being the next and 3,130 +/- a more ideal down side target.”
* * * * * End February 3, Profit Radar Report * * * * *
The S&P 500 spiked 110 point this week. The chart below shows the resistance (red) and support (green) levels mentioned in the February 3 Profit Radar Report.
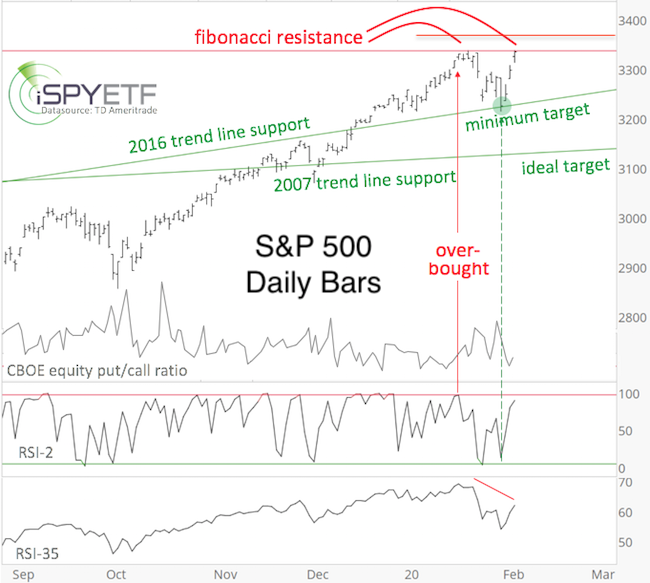
The S&P tagged the minimum down side target, which was based on a trend line going back to 2016. The S&P failed to reach the ideal target, which was based on a trend line going back to 2007, and would have reflected a more proportional correction.
Resistance is still at 3,336. A break above 3,336 would allow for a move to next resistance, but the CBOE equity put/call ratio is getting dangerously low once again, and the RRHM suggests we may not be out of the woods yet.
Continued updates, projections, buy/sell recommendations are available via the Profit Radar Report.
Simon Maierhofer is the founder of iSPYETF and the publisher of the Profit Radar Report. Barron's rated iSPYETF as a "trader with a good track record" (click here for Barron's evaluation of the Profit Radar Report). The Profit Radar Report presents complex market analysis (S&P 500, Dow Jones, gold, silver, euro and bonds) in an easy format. Technical analysis, sentiment indicators, seasonal patterns and common sense are all wrapped up into two or more easy-to-read weekly updates. All Profit Radar Report recommendations resulted in a 59.51% net gain in 2013, 17.59% in 2014, 24.52% in 2015, 52.26% in 2016, and 23.39% in 2017.
|