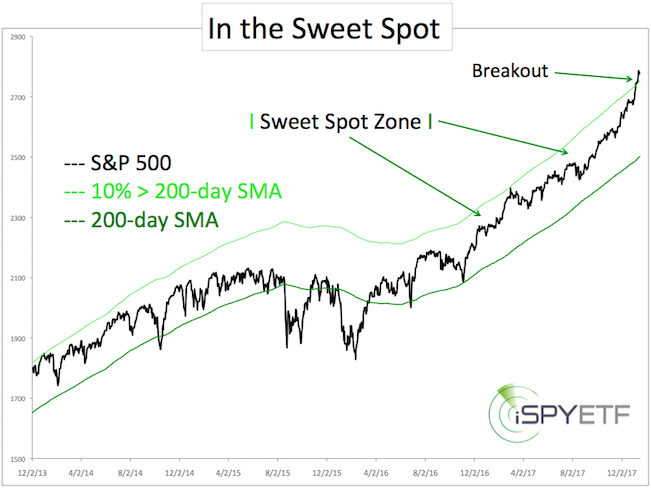
The S&P 500 just traded in the 'sweet spot zone’ for over 350 days. What is the sweet spot zone?
It's above the 200-day SMA, but not more than 10% above the 200-day SMA. While in the sweet spot zone, the S&P has steadily moved higher without overheating. This is extremely rare.
In fact, there are only two other periods similar to this (1965, 1994). Both times the S&P ended the streak by falling below the 200-day SMA. On January 5, for the first time ever, the S&P broke higher (see chart below). What does it mean when the S&P goes from 'not too hot' to 'hot'?
From Not Too Hot to Hot
The research below was originally published in the January 7 Profit Radar Report. At the time (January 7), the S&P 500 recorded 4 consecutive up days and closed at 2,743. The S&P added two more up days, bringing the total to 6 consecutive daily gains to start the year. What's the implication of such a strong start?
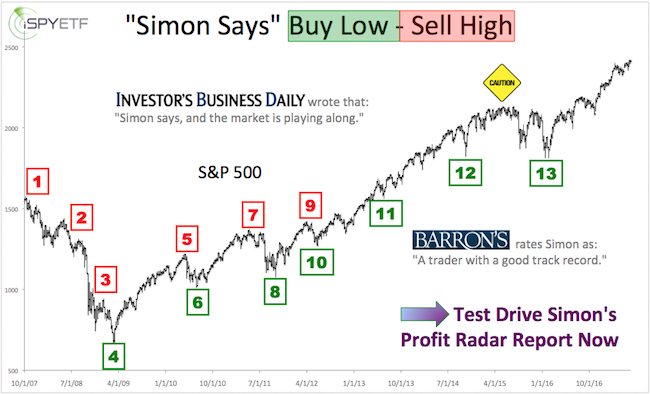
Barron's rates iSPYETF as "trader with a good track record" and Investor's Business Daily says: "When Simon says, the market listens." Find out why Barron's and IBD endorse Simon Maierhofer's Profit Radar Report.
January 7, 2018 Profit Radar Report
Since 1960, the S&P 500 has opened the year with 4 consecutive up days 8 other times (see table).
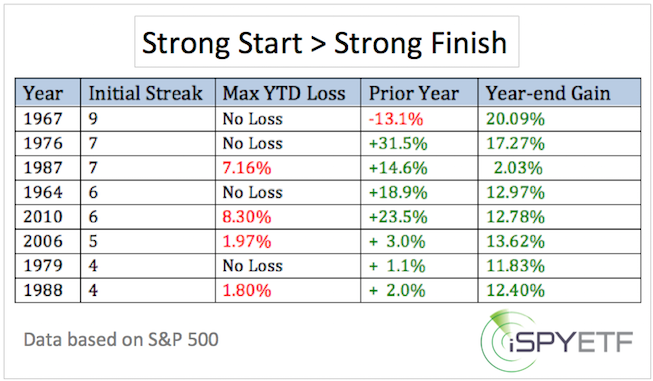
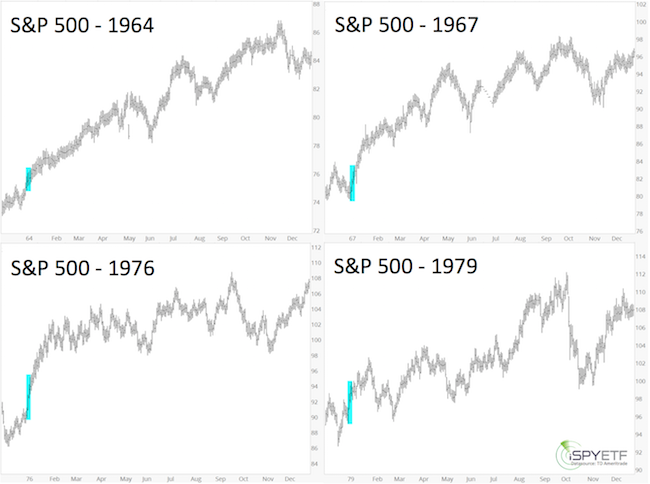
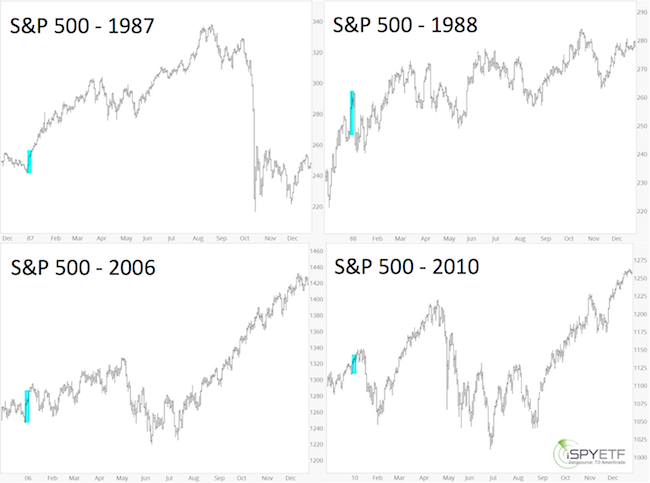
The thumbnail charts below show performance from December 1 before the first-4-day-of-January spurt to December 31 thereafter). By the end of the year, the S&P was higher every single time (1987 – 1988 was the smallest gain with only 0.2%).
50% of the time (the last 4 times), the S&P fell below the January 1 open at some point during the year.
If you enjoy quality, hand-crafted research, >> Sign up for the FREE iSPYETF Newsletter
Based on history, a strong start to January is bullish for the remainder of the year. The risk of a correction throughout the year is 50%.
There is no substitute for knowlege! Be the best informed investor you know, sign up for the Profit Radar Report.
Simon Maierhofer is the founder of iSPYETF and the publisher of the Profit Radar Report. Barron's rated iSPYETF as a "trader with a good track record" (click here for Barron's profile of the Profit Radar Report). The Profit Radar Report presents complex market analysis (S&P 500, Dow Jones, gold, silver, euro and bonds) in an easy format. Technical analysis, sentiment indicators, seasonal patterns and common sense are all wrapped up into two or more easy-to-read weekly updates. All Profit Radar Report recommendations resulted in a 59.51% net gain in 2013, 17.59% in 2014, and 24.52% in 2015.
Follow Simon on Twitter @ iSPYETF or sign up for the FREE iSPYETF Newsletter to get actionable ETF trade ideas delivered for free.
If you enjoy quality, hand-crafted research, >> Sign up for the FREE iSPYETF Newsletter
|
