The S&P 500 is following closely my projection (in yellow) published in the Profit Radar Report’s 2019 S&P 500 Forecast.
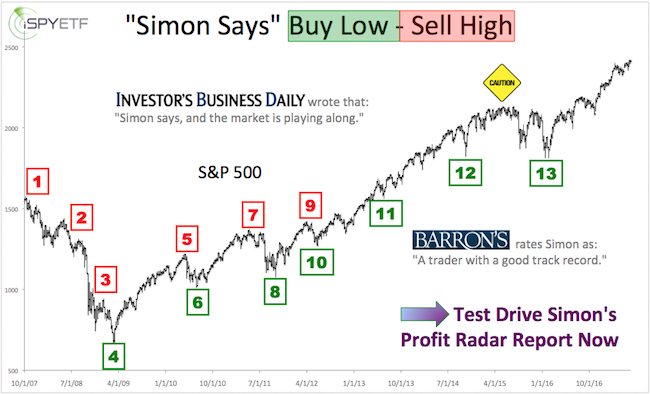
Barron's rates iSPYETF as "trader with a good track record" and Investor's Business Daily says: "When Simon says, the market listens." Find out why Barron's and IBD endorse Simon Maierhofer's Profit Radar Report.
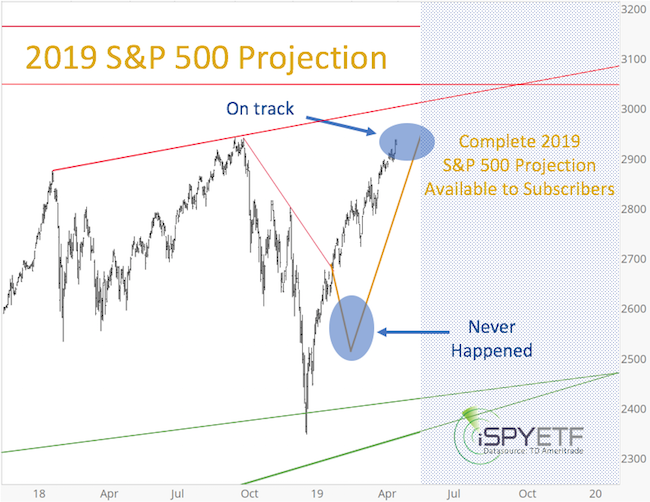
Unfortunately we never got the pullback expected in Q1 2019, but the new all-time highs are right ‘on schedule.’
This doesn’t mean there wasn’t any uncertainty on the way up. The Profit Radar Report always looks at the market from different angles, and at the beginning of April there were enough conflicting indicators and signals to cause analysis paralysis.
Instead of further exploring the various cross currents, and burdening subscribers with information overload, I decided to take the approach described in the April 7 Profit Radar Report:
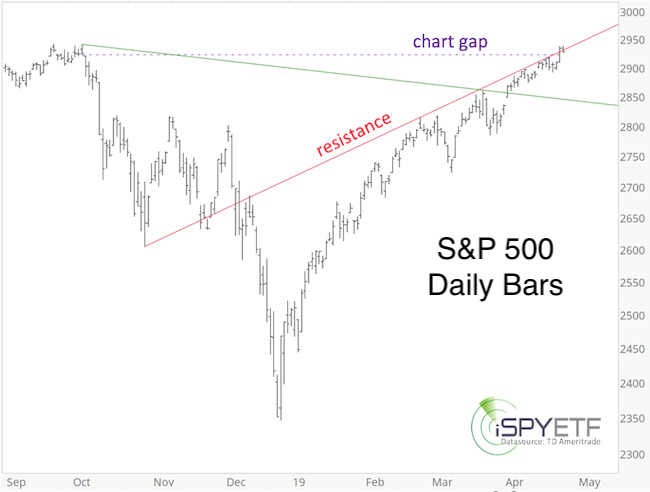
“Perhaps a simplified approach will help navigate this environment. Red trend line resistance has held thus far, and has not become main stream enough to be negated. Green trend line is near-term support. An immediate break above trend line resistance may lead to closure of the open chart gap at 2,921.36.”
Below is an updated version of the chart published on April 7. Instead of breaking above the red trend line to close the gap at 2,921, the S&P 500 has been inching higher like pulled on a zip line.
If you enjoy quality, hand-crafted research, >> Sign up for the FREE iSPYETF e-Newsletter
Regardless of how, the gap has been closed, and the S&P 500 has now one less reason to continue higher without interruption (chart gaps act as magnets).
I wouldn’t be surprised to the see the S&P 500 grind a little higher, but then we should see whether the remainder of my S&P 500 projection - which is quite outrageous - will also prove correct.
Based on investor sentiment, a nasty decline is possible and becoming more likely, but based on liquidity any drop is probably only temporary. According to Elliott Wave Theory, an upcoming drop (once smaller waves 4 and 5 are complete) could be a steep wave C or wave 2, but as long as the S&P stays above 2,900, it can grind higher.
Continued updates are available via the Profit Radar Report.
Simon Maierhofer is the founder of iSPYETF and the publisher of the Profit Radar Report. Barron's rated iSPYETF as a "trader with a good track record" (click here for Barron's evaluation of the Profit Radar Report). The Profit Radar Report presents complex market analysis (S&P 500, Dow Jones, gold, silver, euro and bonds) in an easy format. Technical analysis, sentiment indicators, seasonal patterns and common sense are all wrapped up into two or more easy-to-read weekly updates. All Profit Radar Report recommendations resulted in a 59.51% net gain in 2013, 17.59% in 2014, 24.52% in 2015, 52.26% in 2016, and 23.39% in 2017.
|