The S&P 500 has been on the cusp of breaking below key resistance or above key support for over a month, but decided to stay in limbo.
Does Monday's spectacular (even historic) failure to break higher mean stocks will break down?
Range bound
Many of the Profit Radar Report updates throughout June and July sounded somewhat like the June 24 update inserted in the S&P 500 chart below:
“Unless the S&P breaks below support, it can still rally.”
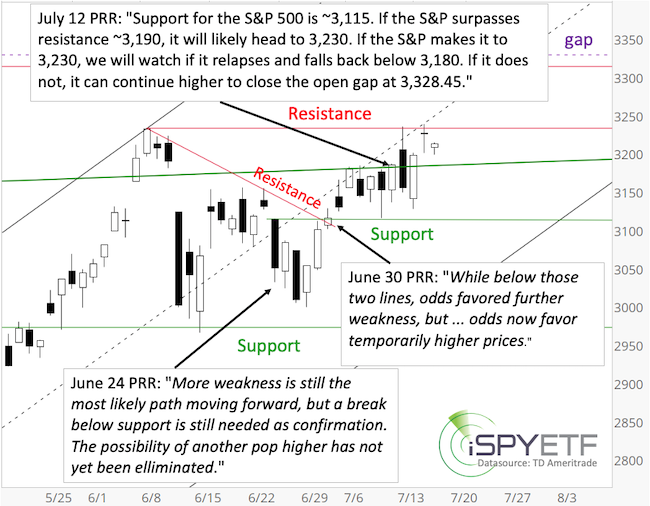
Since the S&P couldn’t make it below support, It rallied from the June 15 and June 29 reaction lows and made it to the top of its trading range.
Last Sunday's (July 12) Profit Radar Report stated the following: "Support for the S&P 500 is around 3,115. If the S&P 500 surpasses resistance around 3,190, it will likely head to 3,230. If the S&P makes it to 3,230, we will watch if it relapses and falls back below 3,180. If it does not, it can continue higher to close the open gap at 3,328.45."
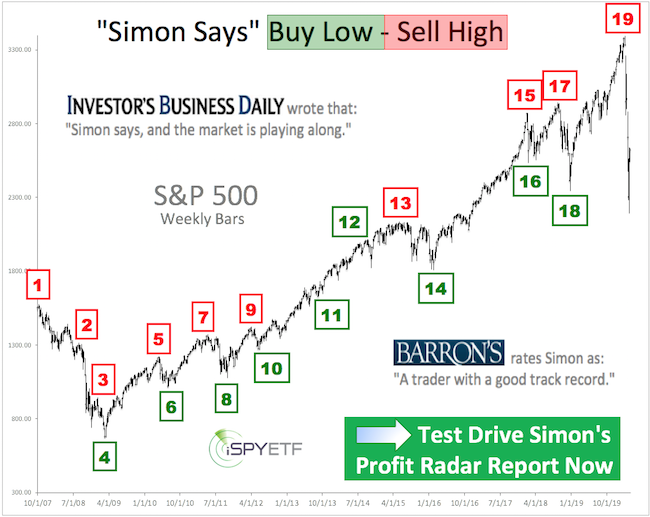
Barron's rates iSPYETF as "trader with a good track record" and Investor's Business Daily says: "When Simon says, the market listens." Find out why Barron's and IBD endorse Simon Maierhofer's Profit Radar Report
I know, that sentence includes a lot of 'ifs' but sometimes the market is just iffy. Setting certain parameters and key levels helps prevent overtrading or plain stupid trades (such as selling before support is broken or buying before resistance is broken).
As far as Sunday's forecast is concerned; the S&P did surpass 3,190, subsequently made it to 3,230, and thereafter relapsed back below 3,180 and even tested support around 3,115.
The S&P was on the cusp of a breakout higher, but failed miserably. The S&P delivered exactly the kind of pattern described the day before, which is often indicative of a reversal. In fact, Monday’s spectacular failure would be a textbook 'U-turn candle.' Perhaps too perfect to be true.
Thus far though, the S&P did neither make it above resistance nor did it fall below support. Still in limbo.
Enough with looking at the past. Here’s what we do to try to determine what’s next:
Breadth & liquidity
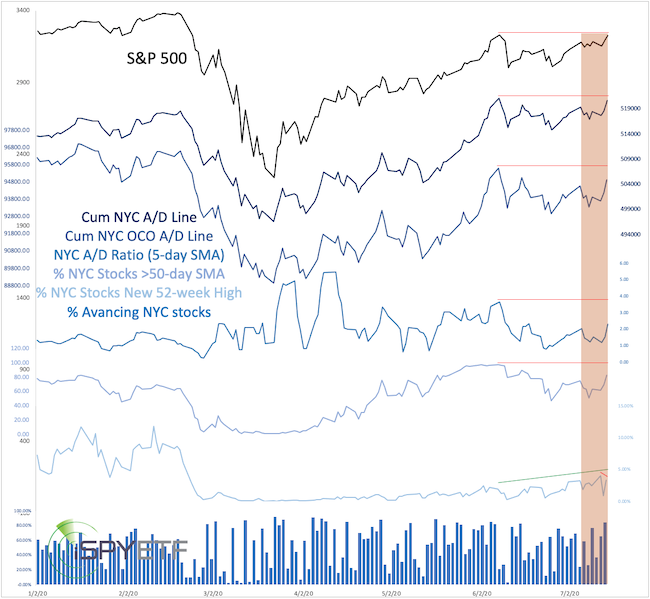
Breadth and liquidity gauges provide tell-tale signs of internal strength or weakness. The chart below (published in yesterday’s Profit Radar Report) plots 6 different breadth and liquidity measures against the S&P 500.
If you enjoy quality, hand-crafted research, sign up for the FREE iSPYETF e-newsletter & market outlook
The S&P is still below its June 8 high (red line), and so are 5 of the 6 gauges. There’s no underlying internal strength. This doesn’t mean a breakout is impossible, but the kind of internal strength usually indicative of a move higher is not present.
Please note though that most breadth and liquidity measures would move above their red line if the S&P 500 does, which would allow for further gains.
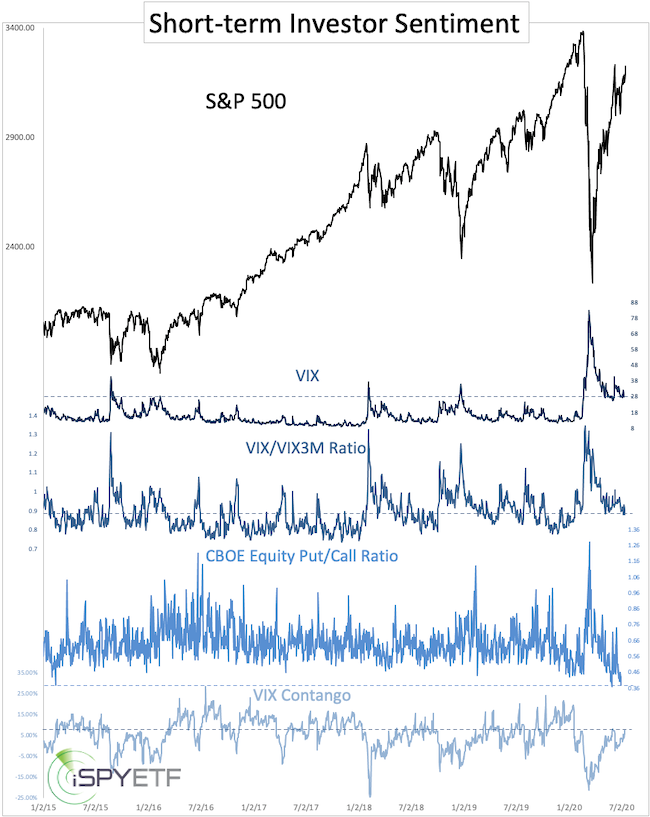
Investor sentiment
Overall investor sentiment is not extreme, but the CBOE equity put/call ratio reflects literally ‘off the charts’ optimism (highest since the year 2000). The CBOE equity put/call ratio is a real time, real money indicator and should not be ignored. This is a red flag.
Leader reversal
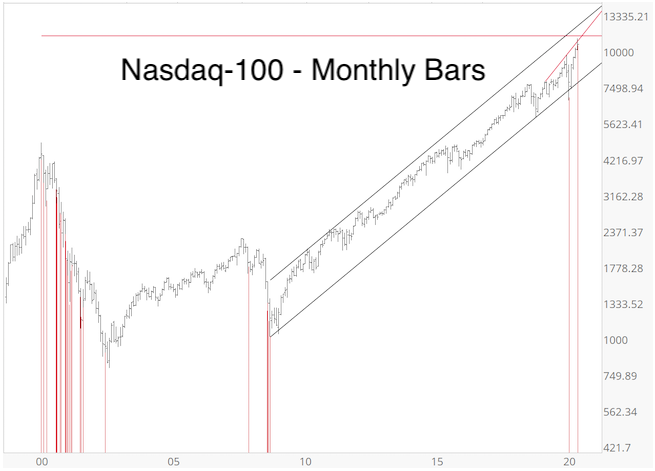
The Nasdaq-100, fearless leader of the speculative world, spiked 2.15% on Monday, set a new all-time high, but ended the day with a 2.16% loss.
This has never happened before. There were 24 other times where the Nasdaq-100 rallied 2% or more intraday and ended the day with a loss of 2% or more. All of those happened during bear markets.
The closest parallel is March 7, 2000, when the Nadsaq-100 rallied 2.33%, set an all-time high, and closed with a 1.49% loss.
As long as the Nasdaq-100 remains below Monday’s high, risk of a deeper pullback is elevated.
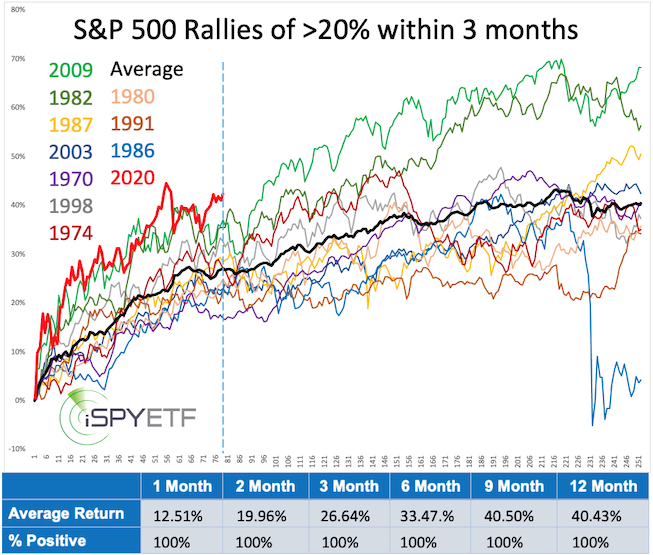
Biggest S&P 500 rallies
The July 12 Profit Radar Report examined the biggest S&P 500 rallies, those times when the S&P soared more than 20% within less then 3 months.
This happened 12 other times (twice in 1982 and 2009). The chart below shows the forward performance (only the first instances of 1982 and 2009 are captured).
The 2020 rally (red graph) has been by far the quickest and strongest. The dashed blue line marks ‘today’ (78 days into the rally). Here are some key takeaways:
-
The S&P is currently up 42.35%, which is already above the 40.43% average 12-month return.
-
The strong rallies of 1982 and 2009 took a breather during the summer.
-
With the exception of 1986, the S&P 500’s 12 month return was higher than the day 78 return every time.
Summary
Down side risk is elevated as long as the S&P 500 cannot close above 3,240 and the Nadaq-100 cannot close above 11,070. It will still take a close below support to usher in a deeper pullback. A move above resistance (3,240 and 11,070) would unlock higher targets, but the CBOE equity put/call ratio suggests that milking a breakout comes with risk.
Continued updates, projections, buy/sell recommendations are available via the Profit Radar Report
Simon Maierhofer is the founder of iSPYETF and the publisher of the Profit Radar Report. Barron's rated iSPYETF as a "trader with a good track record" (click here for Barron's evaluation of the Profit Radar Report). The Profit Radar Report presents complex market analysis (S&P 500, Dow Jones, gold, silver, euro and bonds) in an easy format. Technical analysis, sentiment indicators, seasonal patterns and common sense are all wrapped up into two or more easy-to-read weekly updates. All Profit Radar Report recommendations resulted in a 59.51% net gain in 2013, 17.59% in 2014, 24.52% in 2015, 52.26% in 2016, and 23.39% in 2017.
|