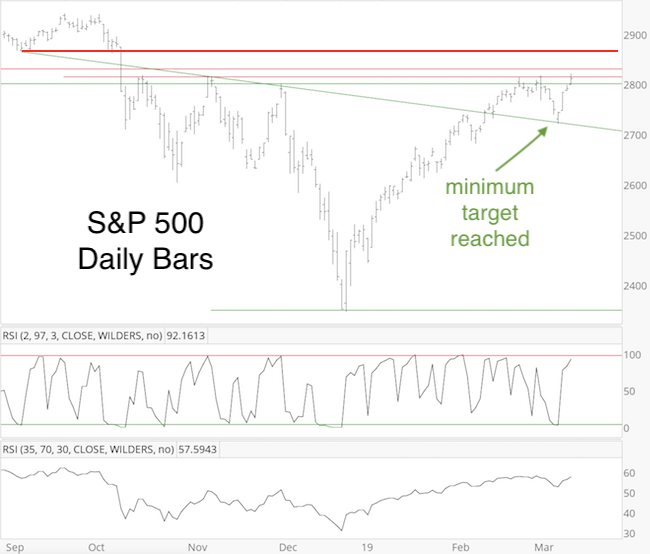
Last week’s S&P 500 update highlighted a triangle and complete 5-wave pattern likely to be followed by a ‘pop and drop’ with a minimum down side target around 2,720.
Price popped to 2,817, and subsequent dropped to 2,722, confirming (and possibly completing) this pattern.
As mentioned in the March 10 Profit Radar Report, to see more down side, the S&P would have had to stay below 2,764, otherwise odds would favor a new high.
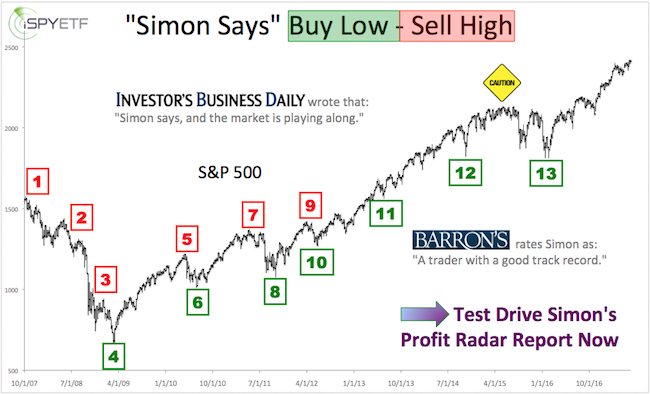
Barron's rates iSPYETF as "trader with a good track record" and Investor's Business Daily says: "When Simon says, the market listens." Find out why Barron's and IBD endorse Simon Maierhofer's Profit Radar Report.
On Monday, the S&P moved above 2,764, and subsequently a new high.
How does that new high fit into the bigger picture?
Time to be honest
My analysis includes many different indicators, but the only one that's really mattered is the December/January breadth thrust discussed here.
Elliott Wave Theory (EWT) on the other hand has been of little help. In fact, I have rarely seen more conflict among EWT analysts with many either adjusting their labels to match stubbornly held interpretations, or changing on a whim.
This can be (and usually is) costly for readers and investors. The honest approach is to just admit when the EWT structure is foggy.
The chart below shows the EWT conundrom: The wave structure going into, and coming out of, the December low is messy, and up to interpretation.
If you are not familiar with EWT, in order to pinpoint the main trend, it's important to discern a clear 5-wave (or at least 3-wave) pattern. A 5-wave pattern usually marks the dominant trend, and is followed by a pullback, and trend continuation.
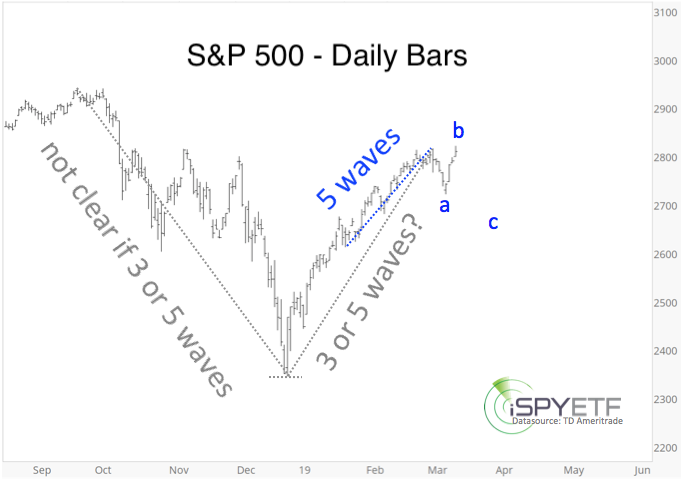
The blue stretch above labeled “5 waves” is the only clear pattern I’ve been able to discern (published real time in the March 3 Profit Radar Report, see chart below).
If you enjoy quality, hand-crafted research, >> Sign up for the FREE iSPYETF e-Newsletter
The completed pattern suggested a 100-point drop (or more). In reality it led to a 95-point drop. Since the drop reached my minimum target (2,720, green trend line, first chart) and stopped after only 3 waves (3 waves are counter trend), it may have completed the entire pullback.
The blue “a-b-c” labels show another valid path, which suggest the S&P 500 will soon relapse and re-visit the 2,700 range.
Technical Analysis
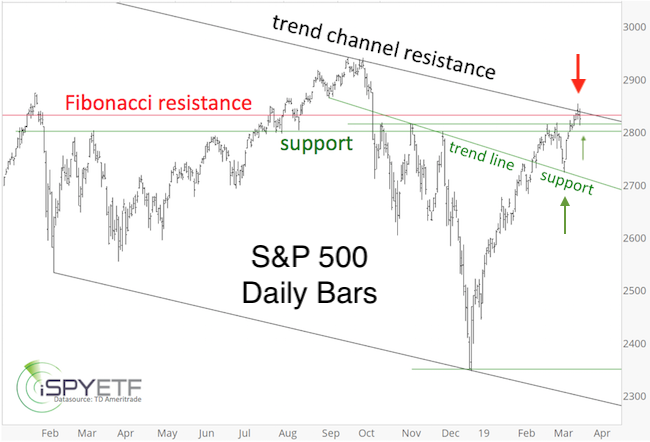
Basic chart analysis shows the S&P 500 bumping against a cluster of resistance (first chart). Risk is elevated while below resistance, but the more obvious a resistance level becomes (such as this one), the more likely it is for price to surpass or see-saw that level.
An immediate U-turn, or a quickly reversed spike above resistance, would be the first indication that the blue path illustrated above is playing out.
Continued updates are available via the Profit Radar Report.
UPDATE (3/21/2019):
Wednesday's pop and drop right after the FOMC meeting opened a window of opportunity for bears. Why? Because trade was rejected by the black trend channel, and the 40-point drop from Monday's high to Tuesday's low took the shape of 5 waves.
To keep this bearish setup alive, the S&P 500 should stay below Tuesday's high and fall below 2,812.
Simon Maierhofer is the founder of iSPYETF and the publisher of the Profit Radar Report. Barron's rated iSPYETF as a "trader with a good track record" (click here for Barron's evaluation of the Profit Radar Report). The Profit Radar Report presents complex market analysis (S&P 500, Dow Jones, gold, silver, euro and bonds) in an easy format. Technical analysis, sentiment indicators, seasonal patterns and common sense are all wrapped up into two or more easy-to-read weekly updates. All Profit Radar Report recommendations resulted in a 59.51% net gain in 2013, 17.59% in 2014, 24.52% in 2015, 52.26% in 2016, and 23.39% in 2017.
Follow Simon on Twitter @ iSPYETF or sign up for the FREE iSPYETF e-Newsletter to get actionable ETF trade ideas delivered for free.
|
