As mentioned in the last S&P 500 update we were looking for stocks to continue lower into the next target/inflection zone, which was around 2,740 (May 29 Profit Radar Report: “We expect 2,740 - 2,720 to be reached. From there, a larger bounce may develop.”).
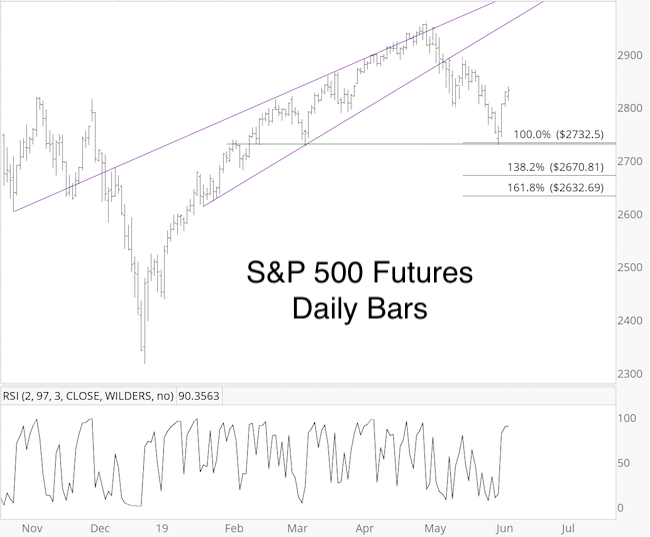
Sunday’s (June 2) Profit Radar Report featured the chart below and stated that: “S&P 500 Futures are down some 15 points in Sunday night’s session and already reached their first target. Aggressive investors afraid of missing out on a bounce (which could turn into something more) may put some money to work.”
Barron's rates iSPYETF as "trader with a good track record" and Investor's Business Daily says: "When Simon says, the market listens." Find out why Barron's and IBD endorse Simon Maierhofer's Profit Radar Report.
This bounce happened, and it happened quickly and honestly stronger than I expected.
Big Fake or Little Fake?
Now the question is: Will stocks relapse or continue to new all-time highs?
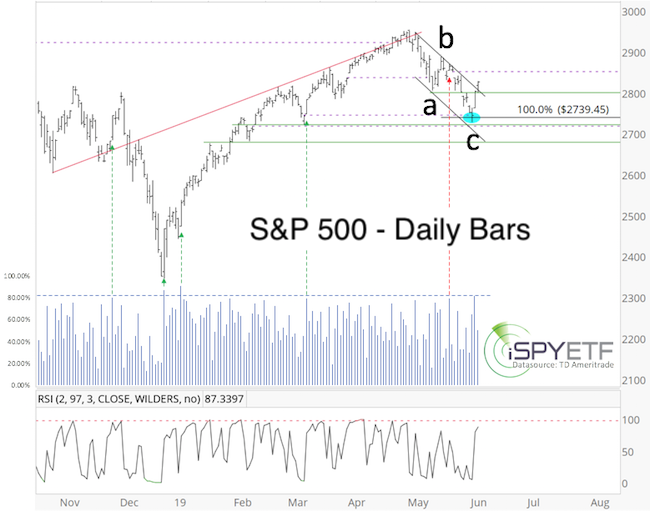
The chart below shows that the S&P 500 fell as low as 2,728.81 on Monday. This drop closed the open chart gap at 2,744.13 and tagged Fibonacci target at 2,739.45, where wave c = wave a (a common target for waves c). The open chart gap at 2,851.11 is the next up side target (I wrote about the power of chart gaps here last week).
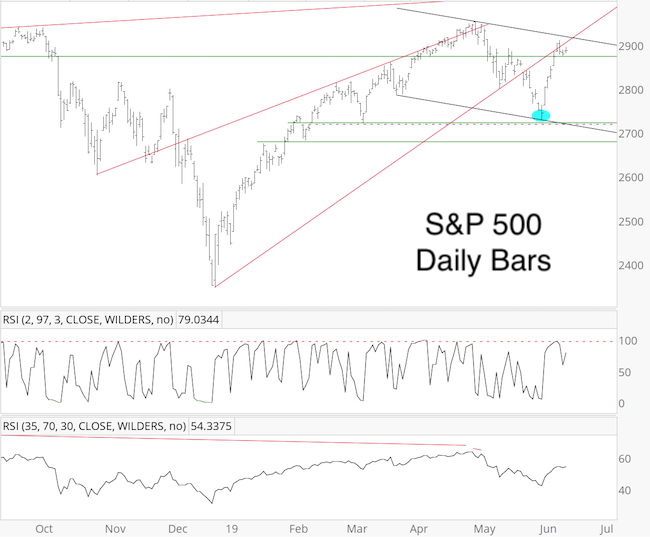
In terms of breadth, this week’s market action was bullish. Despite Monday’s 6-point drop, 65.03% of NYSE stocks advanced (strength ‘under the hood’), and on Tuesday, 81.48% of NYSE stocks advanced.
If you enjoy quality, hand-crafted research, >> Sign up for the FREE iSPYETF e-Newsletter
The horizontal blue line helps us determine other times when more than 80% of stocks advanced. In general it’s been a positive (green lines), but there’ve been false signals as well (May 16, red line and October 16, 2018, not shown).
So Tuesday's strong up day is positive, but not an infallible buy signal.
I still prefer for this rally to relapse. The question is how high it will rally and relapse (big fake, or little fake). The June 2 Profit Radar Report outlined the 4 most likely paths going forward. One was already eliminated by this week's action. That leaves three. Continued updates, projections, and buy/sell recommendations are available via the Profit Radar Report.
UPDATE (June 13, 2019)
Simon Maierhofer is the founder of iSPYETF and the publisher of the Profit Radar Report. Barron's rated iSPYETF as a "trader with a good track record" (click here for Barron's evaluation of the Profit Radar Report). The Profit Radar Report presents complex market analysis (S&P 500, Dow Jones, gold, silver, euro and bonds) in an easy format. Technical analysis, sentiment indicators, seasonal patterns and common sense are all wrapped up into two or more easy-to-read weekly updates. All Profit Radar Report recommendations resulted in a 59.51% net gain in 2013, 17.59% in 2014, 24.52% in 2015, 52.26% in 2016, and 23.39% in 2017.
|