Last week the S&P 500 almost reached the year-end target (2,220) given by the Profit Radar Report back in January. What’s next?
The S&P 500 is up 130 points since the beginning of the month, S&P 500 futures soared as much as 183 points.
Stocks are overbought, and under normal circumstances there should be a noteworthy pullback. But there is reason to expect the abnormal.
When Abnormal Becomes Reality
The August 28 Profit Radar Report published an uber-bullish Elliott Wave Theory-based projection. The Profit Radar Report’s forecasts are always built on multiple indicators, and this bullish projection was confirmed by liquidity, long-term investor sentiment and bullish year-end seasonality.
Barron's rates iSPYETF as "trader with a good track record" and Investor's Bussines Daily says "When Simon says, the market listens." Find out why Barron's and IBD endorse Simon Maierhofer's Profit Radar Report.
The excerpt below is longer than usual, but it explains why an ‘abnormally’ strong rally was likely to develop. From the August 28 Profit Radar Report:
“The two main reasons we want to buy in the foreseeable future is:
1) The breadth thrust off the June low (July 4 PRR)
2) Bullish Elliott Wave Theory potential
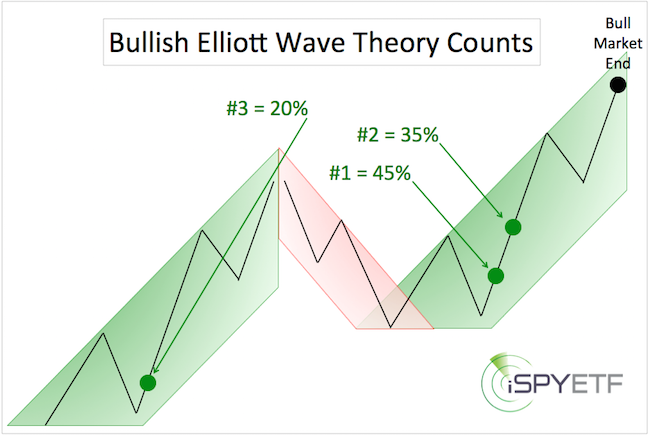
We never rely unduly on any one single indicator. It is noteworthy however, that the three most likely Elliott Wave Theory (EWT) interpretations are all bullish. The degree of bullishness varies, but according to EWT, more gains are ahead. The question is not if, but how much and for how long.
The first chart below shows conceptually where the S&P 500 is at relative to the three most likely EWT options along with the odds for each scenario.
The second chart provides a more detailed (yet basic) outline/labeling of EWT counts #1 (45% probability - light green) and #2 (35% probability - dark green).
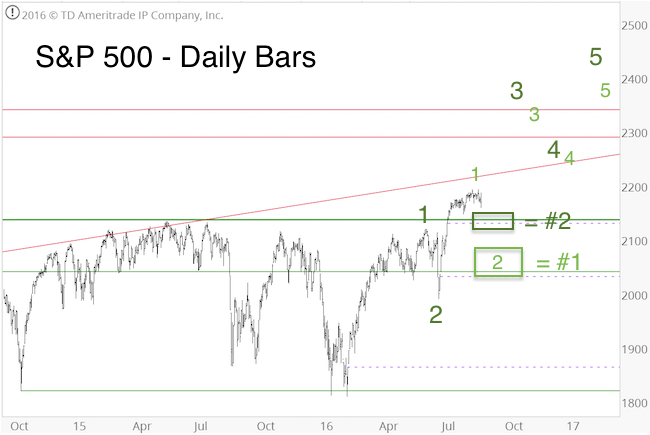
What we are focused on for now is the most likely scope of any pullback. The down side risk for #1 is larger (around S&P 2,130 – 2,070 - see light green square) than for #2 (around S&P 2,150 – 2,130 - see dark green square).
No further detail is shown for the most bullish option, #3 which would translate into a few more years of bull market. At this point, we discount #3 (20% probability) because some cycles point to prolonged weakness starting in H2 2017.
Summary: At this point we don’t know the scope of any pullback, but EWT and the June breadth thrust suggest that any weakness will be bought (perhaps even furiously). We consider the longer-term up side potential to be significantly larger than the down side risk.”
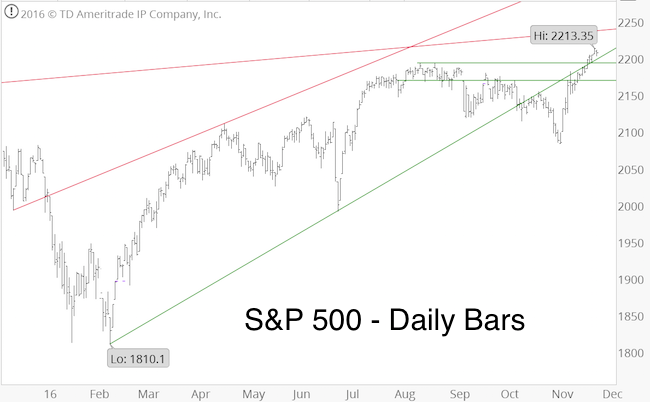
The anticipated pullback drew the S&P 500 to 2,084 (right inside the first target zone). Stocks haven't looked back since.
If you enjoy quality, hand-crafted research, >> Sign up for the FREE iSPYETF Newsletter
The November 13 Profit Radar Report added that: “The DJIA and Russell 2000 ended the week overbought, which normally will cause a pullback. However, if the S&P is truly in a wave 3 advance, stocks will continue to plow higher without much letup.”
Overbought, But No Bearish Divergences
Unless you’re already on the bus, a momentum driven market is one of the hardest markets to get in (like jumping onto a moving bus), because it rarely stops.
At some point momentum will halt (which is sometimes followed by a nasty correction), but the question is when? The chart suggests to watch support at 2,190 – 2,200 (if lucky, we may even see 2,170 - 2,150).
Waves 3 (according to EWT) are generally strong and relentless moves. Stocks appear to be in such a third wave advance.
Many investors consider EWT hocus-pocus, and I can understand way. I’ve seen many horrid EWT interpretations cost investors a ton of money.
That’s why the Profit Radar Report never relies on any one single indicator. As of right now, the weight of evidence (not just EWT) points towards higher prices (with or without prior pullback). We go where the indicators take us.
Back in January, when the S&P traded below 1,900, our year-end target of 2,220 seemed outrageously bullish. As it turns out, it actually may not have been bullish enough.
Continuous updates with actual buy/sell recommendation (which help balance down side risk with the risk of missing out on the up side) are available via the Profit Radar Report.
Simon Maierhofer is the founder of iSPYETF and the publisher of the Profit Radar Report. Barron's rated iSPYETF as a "trader with a good track record" (click here for Barron's profile of the Profit Radar Report). The Profit Radar Report presents complex market analysis (S&P 500, Dow Jones, gold, silver, euro and bonds) in an easy format. Technical analysis, sentiment indicators, seasonal patterns and common sense are all wrapped up into two or more easy-to-read weekly updates. All Profit Radar Report recommendations resulted in a 59.51% net gain in 2013, 17.59% in 2014, and 24.52% in 2015.
Follow Simon on Twitter @ iSPYETF or sign up for the FREE iSPYETF Newsletter to get actionable ETF trade ideas delivered for free.

If you enjoy quality, hand-crafted research, >> Sign up for the FREE iSPYETF Newsletter
|
