On March 26, the Profit Radar Report published the projection below and stated: “We anticipate a recovery towards 3,000 (for the S&P 500) over the next couple months and quite possibly new all-time highs in 2020.”
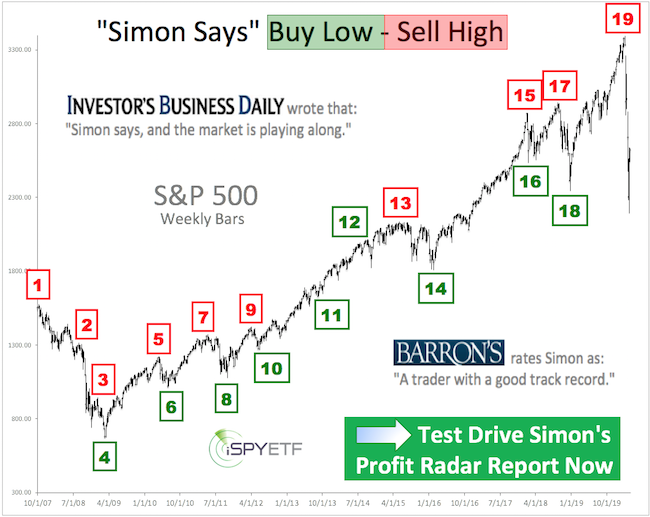
Barron's rates iSPYETF as "trader with a good track record" and Investor's Business Daily says: "When Simon says, the market listens." Find out why Barron's and IBD endorse Simon Maierhofer's Profit Radar Report

Less then two month later, the S&P 500 reached and exceeded 3,000. Are new all-time highs next?
To answer this question, we will take a chronological look at many indicators and studies published (in the Profit Radar Report) over the past couple of months.
April 6, 2020 Profit Radar Report
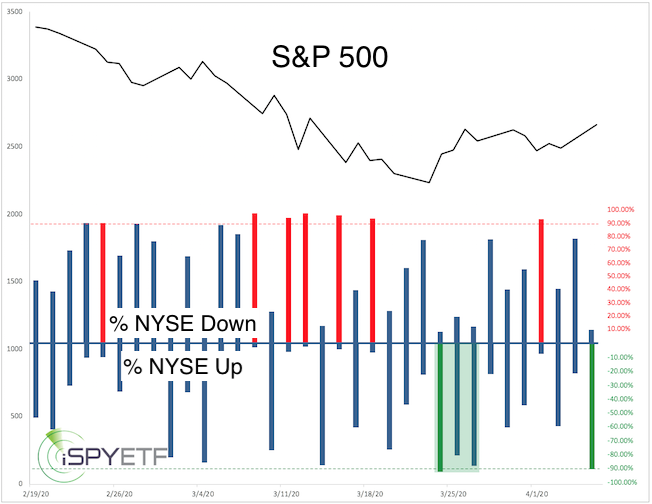
"90.43% of NYSE-traded stocks closed higher for the day. We have seen large clusters of 80% or 90% ‘all or nothing’ days (where 80% or 90% of NYSE-traded stocks and/or volume occur to the up or down side). This too is rare, and has been longer-term bullish (S&P 500 traded higher 6 and 12 months later 90% of the time)."
April 7, 2020 Profit Radar Report
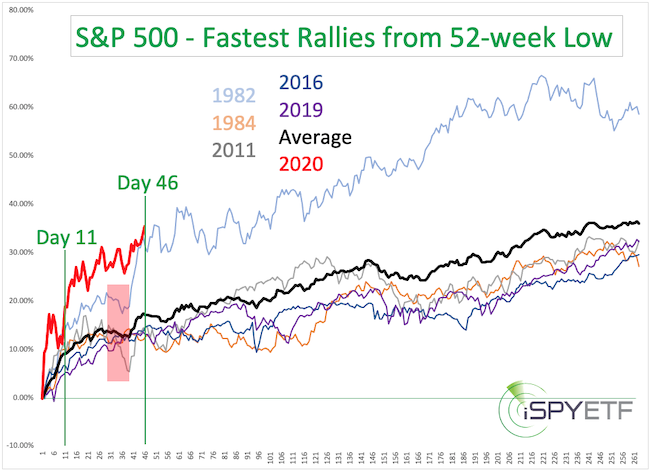
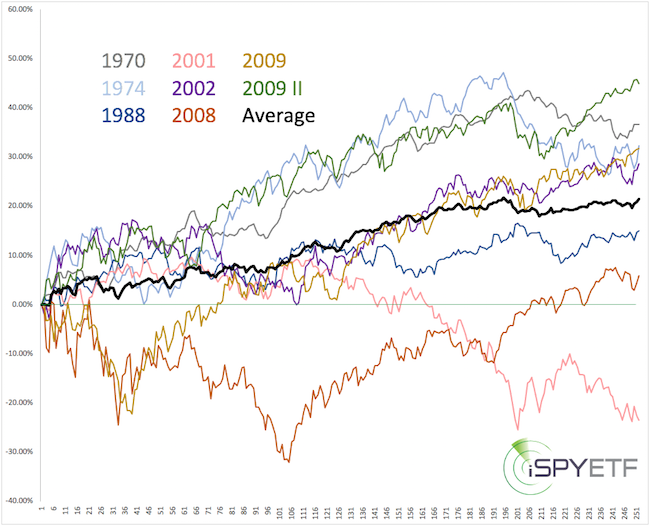
"It took the S&P 500 just 11 days to retrace more than a Fibonacci 38.2% of the previous losses. This is a very quick retracement. Since 1970, there were only 5 other times where the S&P retraced more than 34% that quickly. The chart below shows the forward performance of those 5 times along with the average. As you can see, returns were rock solid." Note: Chart below was updated to include price action until May 27.
If you enjoy quality, hand-crafted research, sign up for the FREE iSPYETF e-newsletter & market outlook
April 12, 2020 Profit Radar Report
"More than 90% of volume went into advancing stocks on 2 days last week (April 6: 91.87%, April 8: 93.13%). This is rare and usually significant. The chart below plots the forward performance of the 6 other times when there were more than 2 90% up volume days in a 3-day period within 1 month of a 52-week low."
April 19, 2020 Profit Radar Report
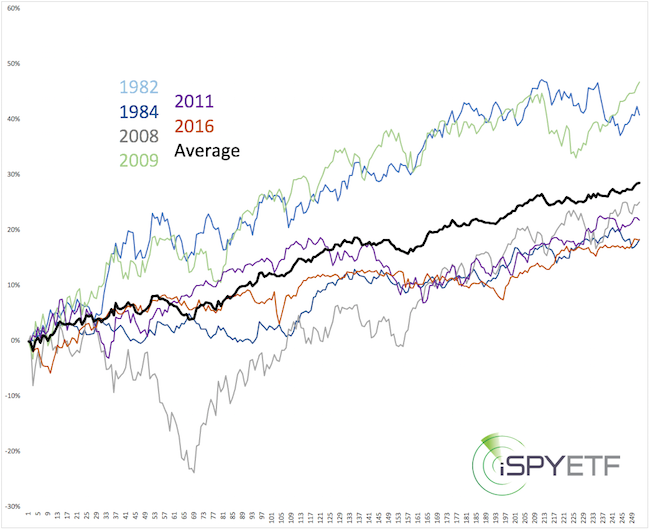
"Historically, rising stocks despite falling earnings are not unusual. Since 1970, there were 8 other earnings seasons following a 30% drop in the S&P 500. The chart below shows the 1-year forward performance of every instance along with the average forward performance."
April 19, 2020 Profit Radar Report
"The March and April PRRs included a ton of data points and studies analyzing the market from all sorts of different angles. Most of the studies and projections pointed to a signifiant rally with a minimum target of 2,900 - 3,000 … and potentially new all-time highs later in 2020.
The S&P 500 has almost reached the ‘first phase’ of our forecast (2,900 - 3,000). While the up side has become more risky, price may continue to move higher as long as the S&P does not fall below support at 2,730 - 2,700."
May 3, 2020 Profit Radar Report
"The April 11 Profit Radar Report fiirst remarked on the strength of this rally, which implied further gains. Below is an updated look at the same chart, which shows that even the strongest rallies from a 52-week low started to take a pause right about 29 days after the low was struck."

Summary
In late April the S&P 500 got very close to our up side target and I was looking for a pullback. This pullback was more shallow than expected. Instead of providing a better buying opportunity at even lower prices, it sparked another rally leg.
The S&P 500 is now trading above the upper Bollinger Band with RSI-2 nearing short-term over-bought. RSI-35 on the other hand continues to confirm new price highs.
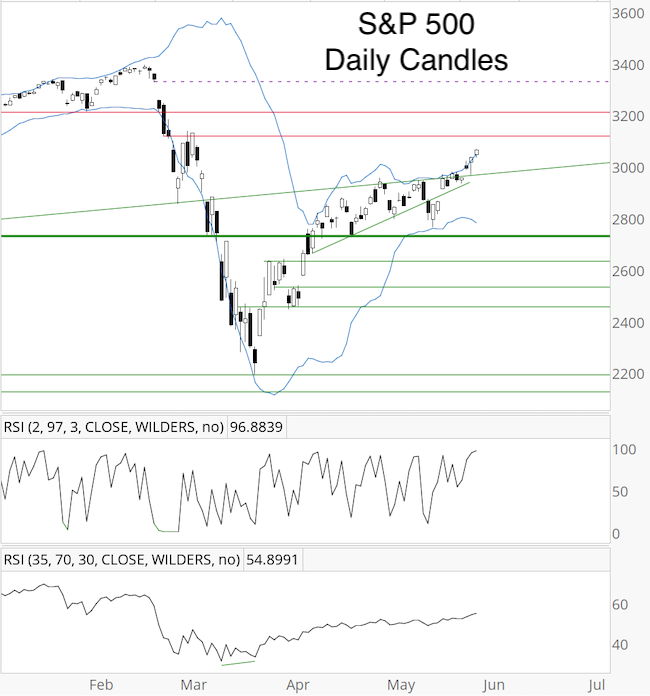
Short-term, this leaves the S&P 500 in ‘melt up’ mode. Usually it does not pay to chase an over-bought market (in fact the risk of a nasty pullback is high), but this could be one of those rare times where stocks defy the odds and grind higher.
At some point, however, there should be a pullback. The weight of evidence suggests that any pullback will be a buying opportunity (minimum target: open chart gap at 3,328.45).
Continued updates, projections, buy/sell recommendations are available via the Profit Radar Report.
Simon Maierhofer is the founder of iSPYETF and the publisher of the Profit Radar Report. Barron's rated iSPYETF as a "trader with a good track record" (click here for Barron's evaluation of the Profit Radar Report). The Profit Radar Report presents complex market analysis (S&P 500, Dow Jones, gold, silver, euro and bonds) in an easy format. Technical analysis, sentiment indicators, seasonal patterns and common sense are all wrapped up into two or more easy-to-read weekly updates. All Profit Radar Report recommendations resulted in a 59.51% net gain in 2013, 17.59% in 2014, 24.52% in 2015, 52.26% in 2016, and 23.39% in 2017.
|