15 points in 12 weeks. That about sums up the S&P 500 ‘progress’ since March 1.
The March 21 Profit Radar Report warned that: “In terms of Elliott Wave Theory, the March 1 high (2,400.98) is a wave 3 high. This means we are in a wave 4 correction. Waves 4 are the most choppy, and unpredictable of all waves. The coming months will likely test investors patience.”
Barron's rates iSPYETF as "trader with a good track record" and Investor's Bussines Daily says "When Simon says, the market listens." Find out why Barron's and IBD endorse Simon Maierhofer's Profit Radar Report.
Predicting a ‘go nowhere’ market is no fun, but it helps set expectations and limits frustration.
Even within trading ranges, there are brief bursts where the market telegraphs its next move.
For example: The May 7 Profit Radar Report featured this chart with 3 projections (based on Elliott Wave Theory).
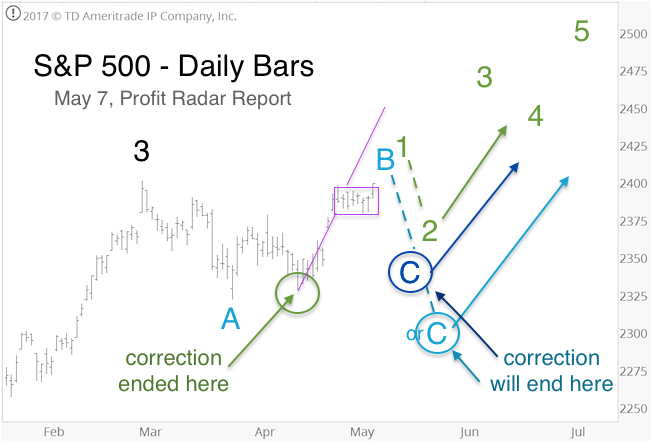
Each option (green, dark blue, and light blue) projected a pullback around S&P 2,410 in mid-May followed by a renewed rally. The pullback happened on May 16, a day after the S&P hit 2,406.
If you enjoy quality, hand-crafted research, >> Sign up for the FREE iSPYETF Newsletter
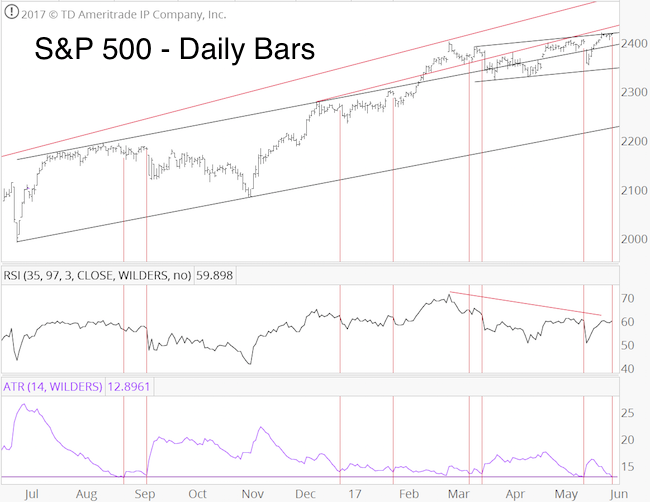
Although this pullback failed to hit our buy trigger (which was set a bit lower), buyers stepped in as anticipated. The S&P has moved as high as 2,419 and is currently held back by trend channel resistance (see chart below).
The rally from the May 18 low at 2,353 seems to support the green Elliott Wave Theory-based projection. If that’s the case, the S&P will continue to move higher.
Although Elliott Wave Theory has been very accurate in recent years (it projected the February 2016 low and the 'Trump rally'), there are reasons (i.e. lake of breadth, bearish divergences, ATR – see vertical red lines in chart above) to take this bullish Elliott Wave projection with a grain of salt.
Therefore it’s best to play the next moves step-by-step. A move above black trend channel resistance is required to unlock the next up side target (red trend line resistance around 2,430).
A move below 2,400 and 2,380 on the other hand, would seriously rattle the immediate bullish potential.
The longer-term outlook shared in the August 28 Profit Radar Report remains valid.
Continuous updates are available via the Profit Radar Report.
Simon Maierhofer is the founder of iSPYETF and the publisher of the Profit Radar Report. Barron's rated iSPYETF as a "trader with a good track record" (click here for Barron's profile of the Profit Radar Report). The Profit Radar Report presents complex market analysis (S&P 500, Dow Jones, gold, silver, euro and bonds) in an easy format. Technical analysis, sentiment indicators, seasonal patterns and common sense are all wrapped up into two or more easy-to-read weekly updates. All Profit Radar Report recommendations resulted in a 59.51% net gain in 2013, 17.59% in 2014, and 24.52% in 2015.
Follow Simon on Twitter @ iSPYETF or sign up for the FREE iSPYETF Newsletter to get actionable ETF trade ideas delivered for free.

If you enjoy quality, hand-crafted research, >> Sign up for the FREE iSPYETF Newsletter
|
