The last S&P 500 update outlined why 2,500+/- has been our up side target for over a year.
Our view has been that S&P 2,500+/- is not the target for a major top, but it should lead to a 5-10% correction.
The August 7 Profit Radar Report zoomed in on 2,495 as short-term target (based on the ascending red trend line) and stated:
“The S&P 500 ETF (SPY) closed at a new all-time high at the lowest volume of the year. The ideal scenario (and tempting setup to go short) would be a spike to 2,495+ followed by an intraday reversal.”
Barron's rates iSPYETF as "trader with a good track record" and Investor's Bussines Daily says "When Simon says, the market listens." Find out why Barron's and IBD endorse Simon Maierhofer's Profit Radar Report.
New Highs! Why?
On August 8, the S&P spiked to 2,490.87 and reversed lower. It initially looked like the 5-10% correction had started, but the August 13 Profit Radar Report warned that:
“Odds for a bounce are high, and based on the wave structure, the likely up side target is 2,465 – 2,470. Purely based on the oversold condition however, the bounce could be stronger.”
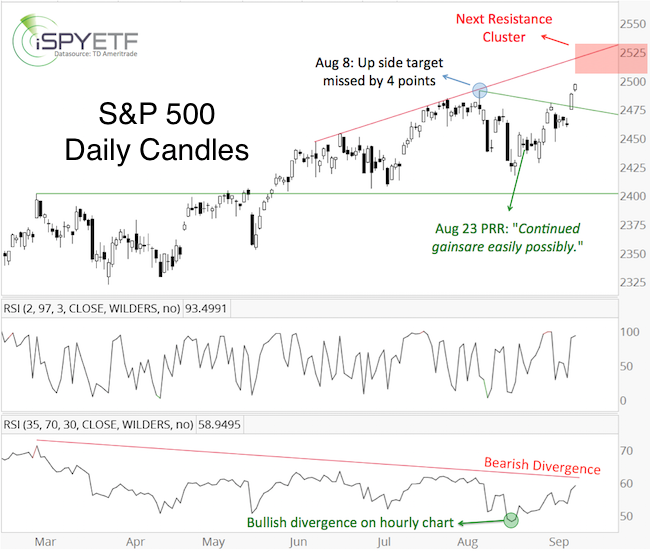
The August 23 Profit Radar Report noted a bullish RSI divergence on the hourly chart, and stated:
“Based on Elliott Wave Theory, this correction could even reach new all-time highs without violating any wave 4 guidelines. Whether this is the case remains to be seen, but it’s an option. Hourly RSI is fairly strong, therefore continued gains are easily possible.”
If you enjoy quality, hand-crafted research, >> Sign up for the FREE iSPYETF Newsletter
New Highs! Top or Not?
On Tuesday, September 12, the S&P surpassed the August 8 all-time high. In terms of Elliott Wave Theory, this high could be wave b of an ongoing wave 4 correction or wave 5 of wave 3, which would lead to the wave 4 correction (other options are possible, but those are the two most likely).
This article explains how and why Elliott Wave Theory has been such a valuable indicator.
The S&P 500 is nearing overbought, there is a bearish RSI divergence on the daily chart and seasonality is soon hitting a weak spot.
However, our reliable liquidity indicator (which has an incredible track record when it comes to sniffing out major tops) confirmed Tuesday’s new S&P highs.
Conclusion
The next inflection range spans from 2,500 – 2,540. Our working assumption is that the 5-10% correction will start then. A break below support around 2,480 is necessary to get some down side momentum going.
Our major market top indicator strongly suggests that the next correction will only be temporary and followed by new highs.
Continued analysis, with down side targets and buy/sell signals are provided via the Profit Radar Report.
Simon Maierhofer is the founder of iSPYETF and the publisher of the Profit Radar Report. Barron's rated iSPYETF as a "trader with a good track record" (click here for Barron's profile of the Profit Radar Report). The Profit Radar Report presents complex market analysis (S&P 500, Dow Jones, gold, silver, euro and bonds) in an easy format. Technical analysis, sentiment indicators, seasonal patterns and common sense are all wrapped up into two or more easy-to-read weekly updates. All Profit Radar Report recommendations resulted in a 59.51% net gain in 2013, 17.59% in 2014, and 24.52% in 2015.
Follow Simon on Twitter @ iSPYETF or sign up for the FREE iSPYETF Newsletter to get actionable ETF trade ideas delivered for free.

If you enjoy quality, hand-crafted research, >> Sign up for the FREE iSPYETF Newsletter
|
