True or false? The S&P 500 is on the longest winning streak without a 3% pullback since the Great Depression.
While you ponder the answer, here are a couple of factoids that may explain the market’s relentless, yet sneaky (no daily gain of more than 1% since September 11) advance.
The September 24 Profit Radar Report published the picture (of bearish MarketWatch headlines) below and stated:
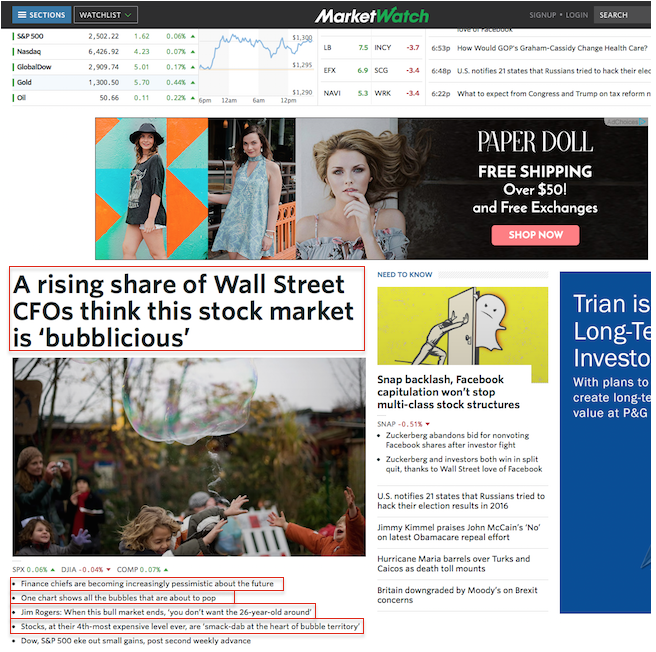
“Our [major market top indicator] continues to confirm the latest S&P 500 highs. Investor sentiment also is not as bullish as one would expect at all-time highs. 5 of the 6 top MarketWatch headlines were bearish on Friday.
Therefore, if bearish seasonality and other short-term bearish forces fail to draw the S&P below 2,480 in the coming week (and the S&P moves above 2,530, we will have to consider a more bullish Elliott Wave Theory structure, which would likely see wave 3 extend to 2,600 +/-.”
Barron's rates iSPYETF as "trader with a good track record" and Investor's Bussines Daily says "When Simon says, the market listens." Find out why Barron's and IBD endorse Simon Maierhofer's Profit Radar Report.
The Answer
The answer to the introductory question is: True. The S&P 500 has never gone longer without a 3% pullback.
The last 3%+ correction concluded on November 3, 2016, just before the presidential election. The second longest streak ended in December 1995.
If you enjoy quality, hand-crafted research, >> Sign up for the FREE iSPYETF Newsletter
True or false? The next 3% correction is just around the corner.
Big Picture
The long-term S&P 500 chart highlights two trend channel resistance levels (see blue chart insert for zoomed-in view).
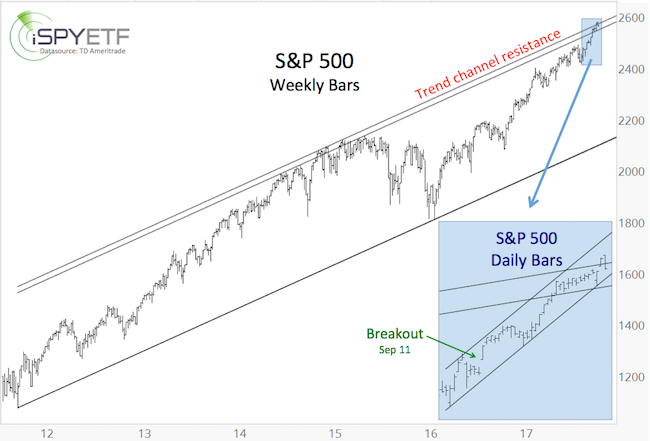
Under normal circumstances, we would expect the S&P 500 to show a significant reaction to the trend channels, but these are obviously not normal circumstances.
Based on the long-term trend channels, we could see a pullback near current trade, but unless this pullback gathers down side momentum, the S&P may grind higher to 2,600+/- before we see a larger correction.
Continued analysis - including our amazingly reliable major market top indicator (which has continually pointed higher) - is provided via the Profit Radar Report.
Simon Maierhofer is the founder of iSPYETF and the publisher of the Profit Radar Report. Barron's rated iSPYETF as a "trader with a good track record" (click here for Barron's profile of the Profit Radar Report). The Profit Radar Report presents complex market analysis (S&P 500, Dow Jones, gold, silver, euro and bonds) in an easy format. Technical analysis, sentiment indicators, seasonal patterns and common sense are all wrapped up into two or more easy-to-read weekly updates. All Profit Radar Report recommendations resulted in a 59.51% net gain in 2013, 17.59% in 2014, and 24.52% in 2015.
Follow Simon on Twitter @ iSPYETF or sign up for the FREE iSPYETF Newsletter to get actionable ETF trade ideas delivered for free.

If you enjoy quality, hand-crafted research, >> Sign up for the FREE iSPYETF Newsletter
|
