Two of the most powerful stock market forces are facing off in an epic tug-of-war. Momentum vs sentiment.
On October 25, 2019, the S&P 500 broke above the blue triangle shown below. Although this break suggested higher prices, I did not - at first - expect such relentless momentum.
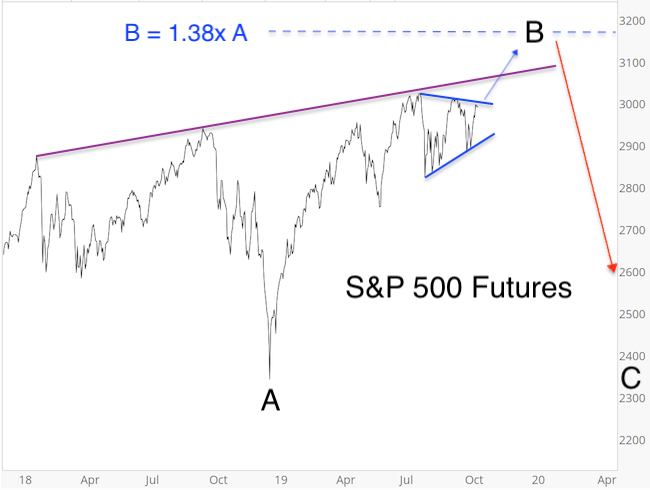
But in late November it became clear that we are dealing with a rare momentum market and I warned via the November 24 Profit Radar Report that: “Momentum markets tend to move higher than expected.”
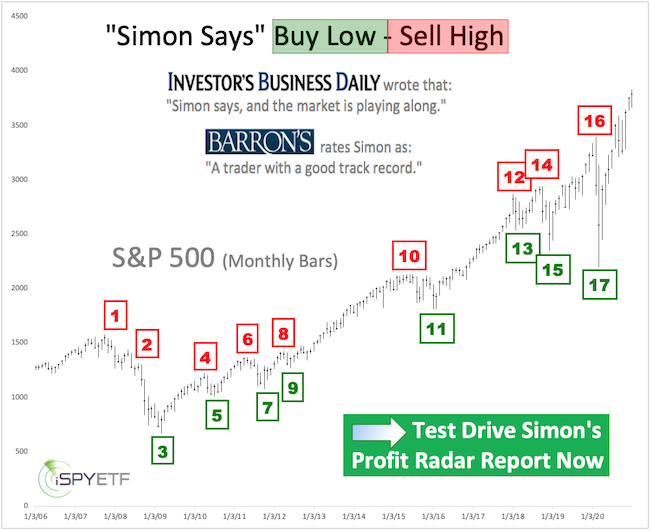
Barron's rates iSPYETF as "trader with a good track record" and Investor's Business Daily says: "When Simon says, the market listens." Find out why Barron's and IBD endorse Simon Maierhofer's Profit Radar Report.
Here is one example of why momentum markets do not die easily: On December 12, the NY Composite hit a new high for the first time in 20 month. Since 1970, the NYC hit a 20-month high 8 other times. 3 month later, it was higher every time. 1 year later, it was higher 7 times.
Of course, a by-product of persistent gains is increase optimism. In fact, in mid-December we started seeing some legitimate extremes of enthusiasm. The equity put/call ratio set a number of extremes, one of them being a 1-year low. When this happened in the past, the S&P 500 was higher 1 and 3 month later only 33% of the time.
Here is the chain reaction extreme optimism tends to trigger:
-
Most investors have converted into buyers
-
There are few buyers left to bid up price
-
Sellers outnumber buyers and price falls, often rapidly
The Stage is Set
The stage has been set and the battle between momentum (bullish for stocks) and excessive optimism (bearish for stocks) has begun.
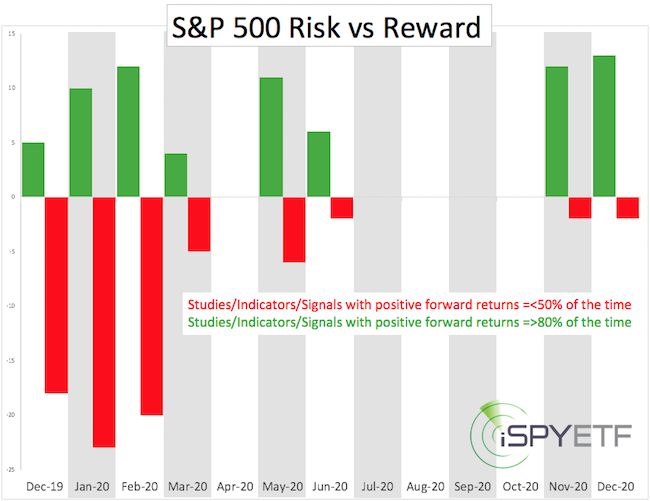
To better assess and gauge the risk/reward potential going forward, I introduced the risk/reward-meter or risk/reward heat map in December.
Risk/Reward Heat Map
Here is how this heat map is compiled: I look at various indicators, studies, signals (ISSs) and calculate their statistical forward return over the next 1, 2, 3, 6, 9, 12 month.
The ISSs include the two examples mentioned above, as well as other ISSs related to sentiment, momentum, money flow, technical break outs (or break downs), certain economic indicators (like the yield curve), seasonality, cycles, etc.
-
ISSs with positive forward returns 80% (or more) of the time are added to the green reward side.
-
ISSs with negative forward returns 50% (or less) of the time are added to the red risk side.
The result is a visual heat map. Below is the first heat map published back in December. Since then, the visual has been refined and dozens of additional ISSs have been added.
The continuously updated heat map is available via the Profit Radar Report.
Technical Analysis
The risk/reward heat map allows us to properly and objectively assess current risk, but it is not a stand alone tool. Why? Risk only becomes reality when price follows.
If you enjoy quality, hand-crafted research, >> sign up for the FREE iSPYETF e-newsletter & market outlook
The S&P 500 futures chart shows that price has been advancing within a trend channel. I am showing the futures chart because it includes over-night activity and reveals price action not seen in the S&P 500 cash chart.
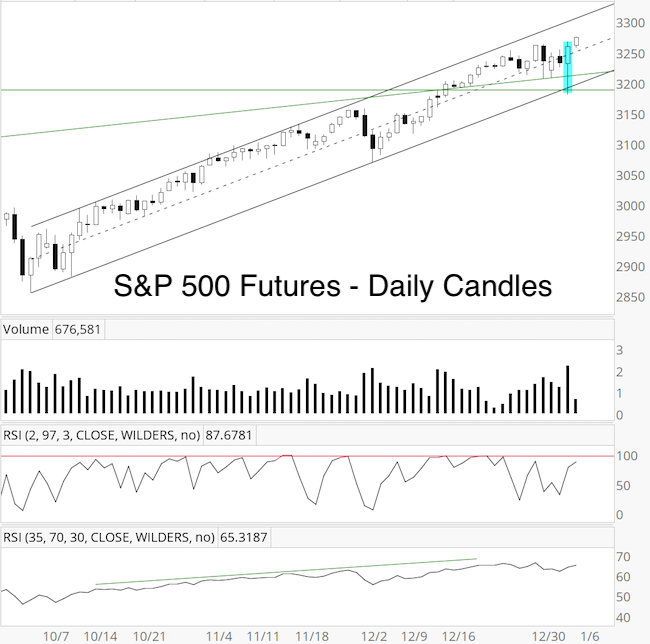
For example, on Tuesday night, S&P 500 futures fell over 70 points or 2% to test trend channel support (this move happened overnight and is ‘invisible’ on the S&P 500 cash chart), but support held and the trend remains up.
Based on the risk/reward heat map, risk outweighs reward for the January/February period, but a break below support is still needed to trigger a deeper pullback.
Continued updates, projections, buy/sell recommendations are available via the Profit Radar Report.
Simon Maierhofer is the founder of iSPYETF and the publisher of the Profit Radar Report. Barron's rated iSPYETF as a "trader with a good track record" (click here for Barron's evaluation of the Profit Radar Report). The Profit Radar Report presents complex market analysis (S&P 500, Dow Jones, gold, silver, euro and bonds) in an easy format. Technical analysis, sentiment indicators, seasonal patterns and common sense are all wrapped up into two or more easy-to-read weekly updates.
|