The S&P 500 is in the midst of a tug of war between a bullish triangle break out and bearish divergences. Who will win, bulls or bears?
Bullish Triangle
The weekly S&P 500 chart below illustrates the bullish triangle potential. Triangle resistance (now support) is around 2,800. The measured target is calculated by projecting the maximum depth to the up side (dashed green arrows).
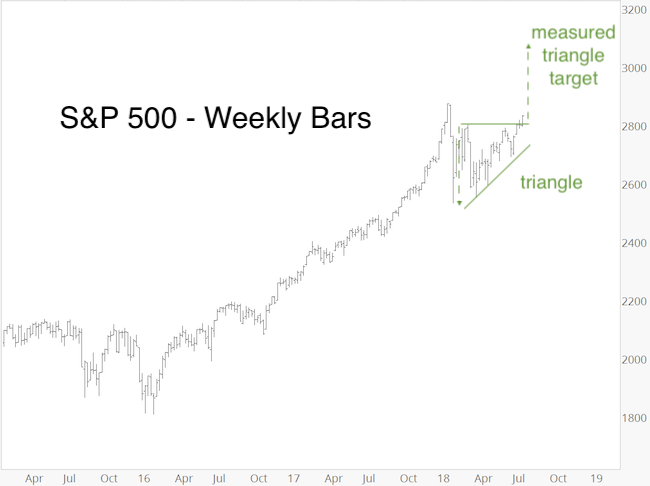
Thus far the S&P has held above 2,800, which is the first step towards confirming the triangle. Yet, there is risk of a fake out break out. How so?
Bearish Divergences
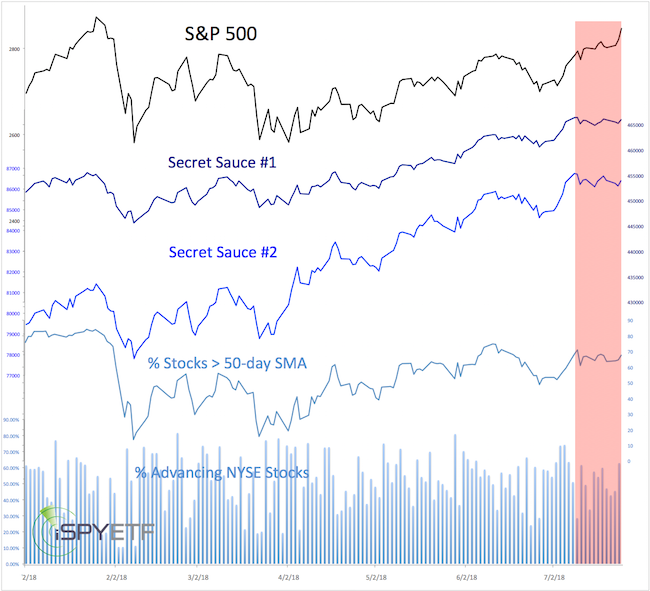
The S&P 500 closed at the highest level since January 29, but underlying breadth has been weaker than price leads us to believe.
If you enjoy quality, hand-crafted research, >> Sign up for the FREE iSPYETF Newsletter
The red bar shows that my favorite liquidity indicators (dubbed ‘secret sauce’, more details available here) failed to confirm the new recovery highs.
Admittedly, the bearish divergences could be erased by one strong day, but while alive, risk is elevated.
Bearish Divergences in Context with Technical Analysis
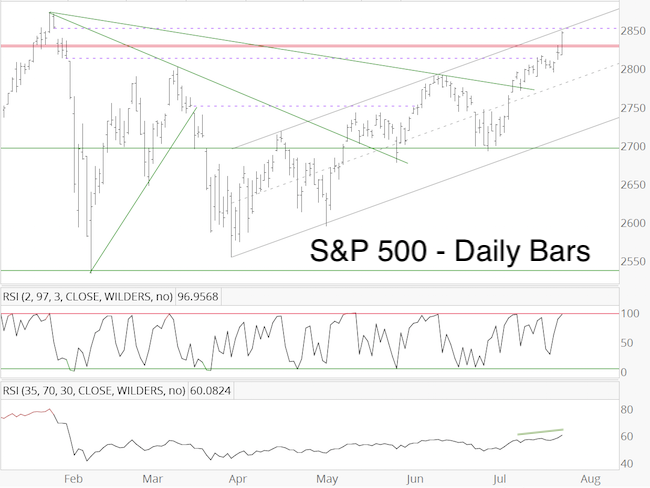
The July 15 Profit Radar Report stated that: “The S&P 500 is at the bottom end of the 2,800 – 2,850 zone, which is filled with resistance levels and open chart gaps. Resistance is at 2,808 (January 16 high), 2,830 (combination of two long-term Fibonacci projection levels), 2,839 (January 31 high), and 2,873 (January 26 high). Chart gaps (which act as magnets) are at 2,812.70 and 2,851.48.”
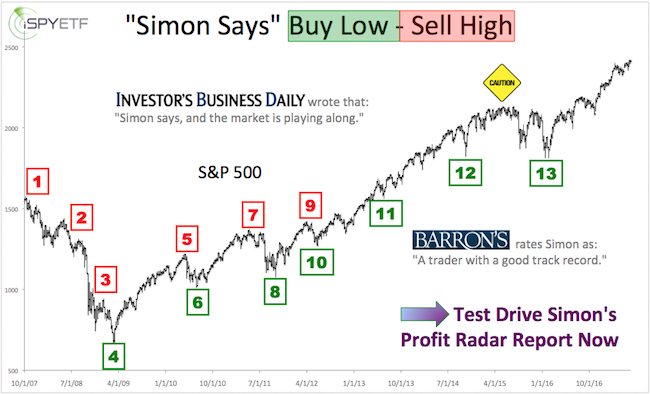
Barron's rates iSPYETF as "trader with a good track record" and Investor's Business Daily says: "When Simon says, the market listens." Find out why Barron's and IBD endorse Simon Maierhofer's Profit Radar Report.
The gap at 2,812.70 was closed on July 17. On July 25 the S&P overcome resistance at 2,830 and almost closed the open gap at 2,851.48.
Short-term Outlook
Further gains are possible while above 2,830 (and 2,800), but bearish divergences (while they exist) suggest the risk is elevated.
Long-term Outlook
The longer-term S&P 500 outlook is discussed here
Continued updates are available via the Profit Radar Report.
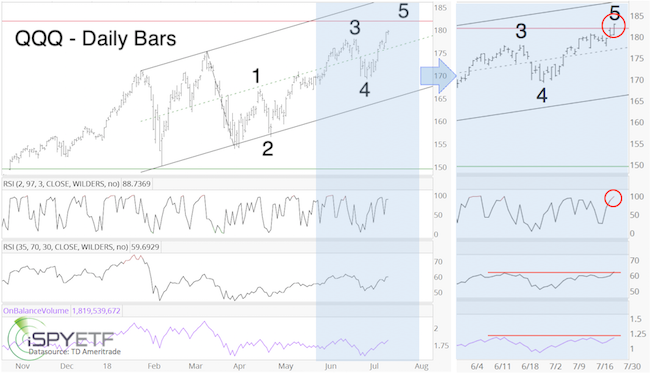
BONUS CHART
The chart below shows the bearish divergences and Elliott Wave Theory count leading up to the latest Nasdaq-100 QQQ top. The left portion shows the projection featured in the July 15 Profit Radar Report, the right portion includes updated price (as of yesterday's close, before Facebook hit the fan). Bottom line, risk is elevated while trade is below resistance (red line @ 181.80 is Fibonacci projection resistance going back to 2002 low)
Simon Maierhofer is the founder of iSPYETF and the publisher of the Profit Radar Report. Barron's rated iSPYETF as a "trader with a good track record" (click here for Barron's profile of the Profit Radar Report). The Profit Radar Report presents complex market analysis (S&P 500, Dow Jones, gold, silver, euro and bonds) in an easy format. Technical analysis, sentiment indicators, seasonal patterns and common sense are all wrapped up into two or more easy-to-read weekly updates. All Profit Radar Report recommendations resulted in a 59.51% net gain in 2013, 17.59% in 2014, 24.52% in 2015, 52.26% in 2016, and 23.39% in 2017.
Follow Simon on Twitter @ iSPYETF or sign up for the FREE iSPYETF Newsletter to get actionable ETF trade ideas delivered for free.
If you enjoy quality, hand-crafted research, >> Sign up for the FREE iSPYETF Newsletter
|
