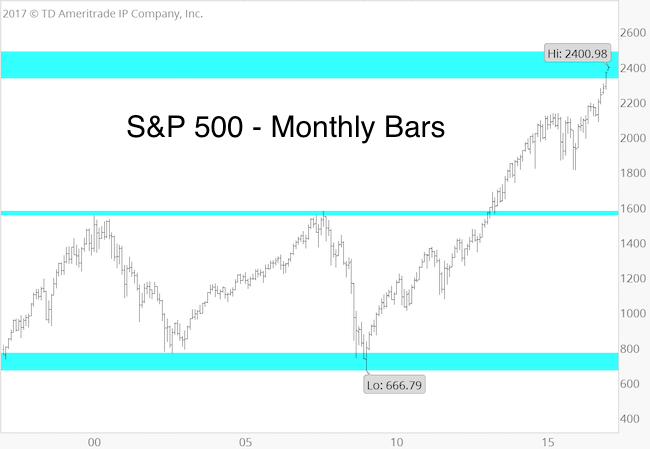
The S&P 500 has reached the up side target zone highlighted in February and August/September 2016. Now what?
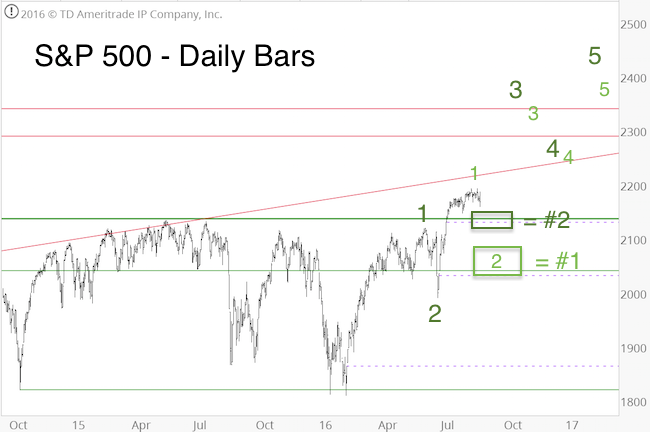
The August 28, 2016 PRR published the chart below and stated: “Elliott Wave Theory and the June breadth thrust suggest that any weakness will be bought (perhaps even furiously). We consider the longer-term up side potential to be significantly larger than the down side risk.”
Barron's rates iSPYETF as "trader with a good track record" and Investor's Bussines Daily says "When Simon says, the market listens." Find out why Barron's and IBD endorse Simon Maierhofer's Profit Radar Report.
Since the wave 2 pullback was on the shallow side, the dark green Elliott Wave Theory count (with wave 3 target around 2,390) became operative.
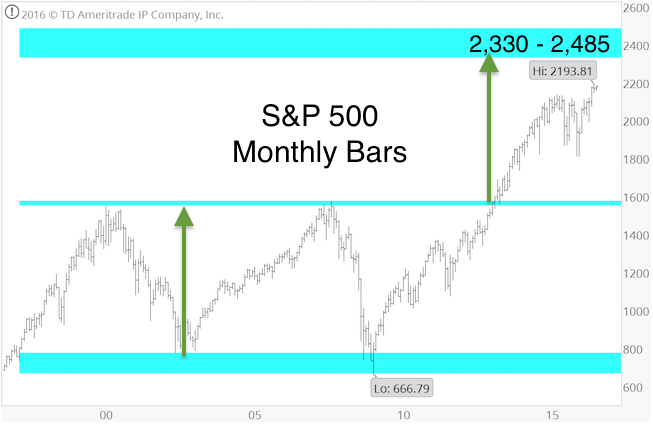
The September 5, 2016 Profit Radar Report said the following: “The chart below shows the long-term up side target purely based on projected symmetry. Based on the 1997 – 2013 trading range, the measured up side target is S&P 2,330 – 2,485, which is in the general vicinity of the 2,290 – 2,342 Fibonacci levels mentioned in the 2016 S&P 500 Forecast. Higher targets are possible, but we'll reassess once we get there.”
If you enjoy quality, hand-crafted research, >> Sign up for the FREE iSPYETF Newsletter
As the updated symmetry chart shows, “we are here!” Now what?
Stocks are at peak momentum (35-day RSI is at the highest level in 20+ years). As the Profit Radar Report highlighted many times in the past (most recently on December 14), stocks rarely ever top at peak momentum.
This means, we are not at a major market top. But the risk of a pullback is increasing. The latest Profit Radar Report shows the most likely spot for a pullback, along with the scope of any pullback.
Simon Maierhofer is the founder of iSPYETF and the publisher of the Profit Radar Report. Barron's rated iSPYETF as a "trader with a good track record" (click here for Barron's profile of the Profit Radar Report). The Profit Radar Report presents complex market analysis (S&P 500, Dow Jones, gold, silver, euro and bonds) in an easy format. Technical analysis, sentiment indicators, seasonal patterns and common sense are all wrapped up into two or more easy-to-read weekly updates. All Profit Radar Report recommendations resulted in a 59.51% net gain in 2013, 17.59% in 2014, and 24.52% in 2015.
Follow Simon on Twitter @ iSPYETF or sign up for the FREE iSPYETF Newsletter to get actionable ETF trade ideas delivered for free.

If you enjoy quality, hand-crafted research, >> Sign up for the FREE iSPYETF Newsletter
|
