From the very beginning, we considered the pullback from the January 26 high to be a temporary correction (wave 4 according to Elliott Wave Theory), not the beginning of a new bear market.
The chart below describes the concept of Elliott Wave Theory in simple terms. Here is how the Profit Radar Report describes wave 4 corrections in general:
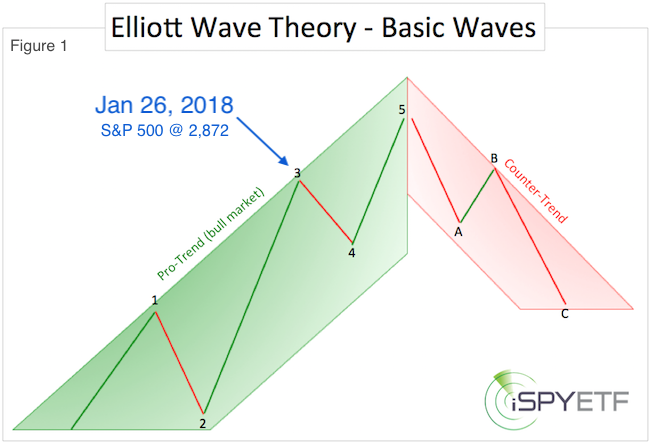
“Wave 4 is the most boring and frustrating of all Elliott Waves. It tends to move sideways with a corrective bias. The market appears to be churning aimlessly, investors lose interest, and trading volume declines. Wave 4 tends to retrace around 38.2% of wave 3.”
The S&P 500 retraced 38.2% of its preceding wave 3 at 2,536 on February 9. Detailed analysis provided by the Profit Radar Report at the time is available here.
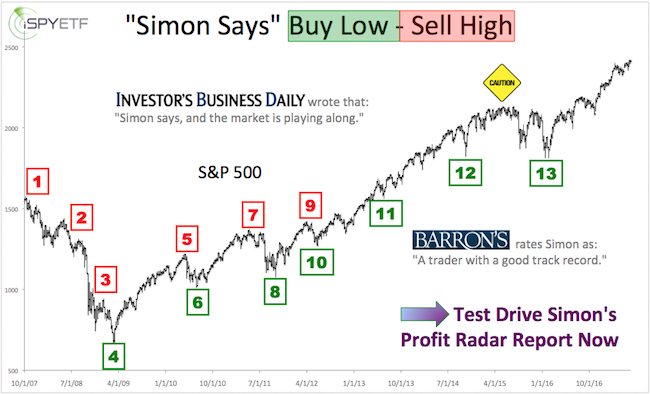
Barron's rates iSPYETF as "trader with a good track record" and Investor's Business Daily says: "When Simon says, the market listens." Find out why Barron's and IBD endorse Simon Maierhofer's Profit Radar Report.
Wave 4 corrections come in many shapes and patterns, that’s why they are so difficult to predict.
‘Buy the dip’ is the most effective approach during a wave 4 correction. The April 2 Profit Radar Report stated that: “The S&P 500 has met the minimum criteria to consider this correction complete,” and offered specific buy recommendations (free reprint of the Profit Radar Reports surrounding the April 2 low is available here).
One of the patterns the Profit Radar Report has been tracking since April is the triangle. The chart below, published in the April 15 Profit Radar Report, showed potential paths inside a triangle. The common denominator among all three options was an eventual rally.
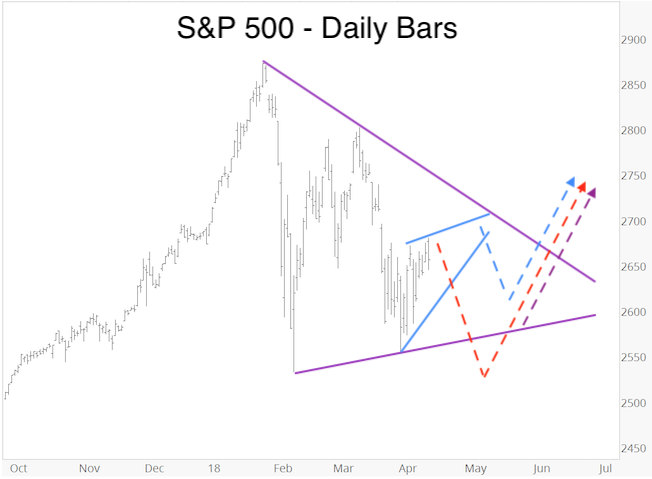
It looks like the S&P 500 chose the blue path.
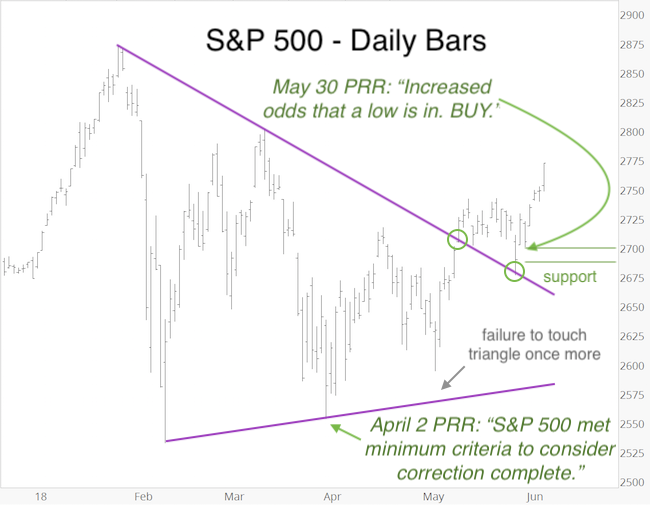
On May 9, the S&P 500 broke above purple triangle resistance, and successfully back-tested the triangle line (now support) on May 29 (green circles).
The May 30 Profit Radar Report stated that: “Today’s bounce erased all of yesterday’s losses and then some. Although today didn’t qualify as a 90% up day (where 90%+ of NYC stocks advance – a breadth thrust), it displayed the strongest up side breadth we’ve seen in a while. The S&P 500 performance of the last two days increases the odds that a low is in, or at least a more significant rally is developing. Why? Yesterday’s drop may have shaken out ‘weak hands,’ and today’s rally showed internal strength. We will leg into the S&P 500 on a drop to 2,710. Buy SPY if it drops below 271.25.”
If you enjoy quality, hand-crafted research, >> Sign up for the FREE iSPYETF Newsletter
It looks like the S&P 500 completed its wave 4 correction, and is now in the early stages of wave 5 to new all-time highs.
At Wednesday’s close, the S&P 500 was near overbought, with the CBOE equity put/call ratio unusually low. This generally translates into a pullback (which may be shallow this time around).
Since the S&P still remains in its larger trading range, it is impossible to confirm for certain that wave 4 is indeed complete. Nevertheless, unless the S&P drops back below 2,700 (and the May 29 low), we will assume that a low is in. Additional support worth watching is around 2,740.
Continued updates are available via the Profit Radar Report.
Simon Maierhofer is the founder of iSPYETF and the publisher of the Profit Radar Report. Barron's rated iSPYETF as a "trader with a good track record" (click here for Barron's profile of the Profit Radar Report). The Profit Radar Report presents complex market analysis (S&P 500, Dow Jones, gold, silver, euro and bonds) in an easy format. Technical analysis, sentiment indicators, seasonal patterns and common sense are all wrapped up into two or more easy-to-read weekly updates. All Profit Radar Report recommendations resulted in a 59.51% net gain in 2013, 17.59% in 2014, 24.52% in 2015, 52.26% in 2016, and 23.39% in 2017.
Follow Simon on Twitter @ iSPYETF or sign up for the FREE iSPYETF Newsletter to get actionable ETF trade ideas delivered for free.
If you enjoy quality, hand-crafted research, >> Sign up for the FREE iSPYETF Newsletter
|
