Subscribers to iSPYETF’s free e-mail newsletter receive a market outlook, usually once a week. The market outlook below was sent out on November 18, 2021. If you’d like to sign up for the free e-newsletter, you may do so here (we will never share your e-mail with anyone, just as we don't accept advertising).
The markets are moving in line with our forecasts (we've been long IWM, DBA, silver, gold), but how long will the party last?
To address this question, we're revisiting some remarkable studies conducted earlier this year.
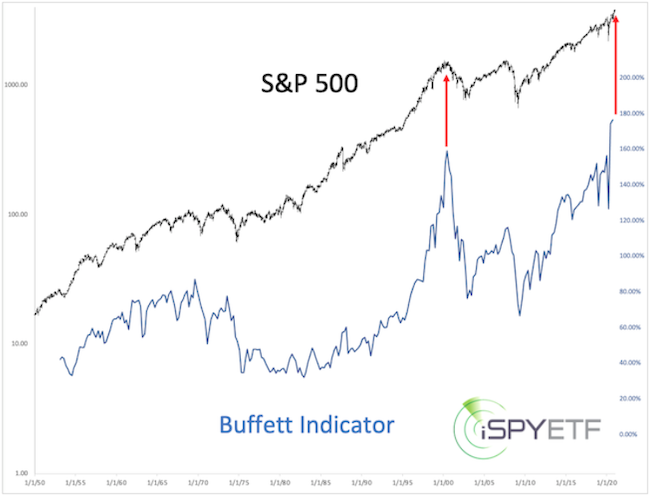
You've probably seen charts like this before. This one in particular was from January, when a determined bundle of analysts claimed that the Buffett Indicator is way over-valued and stocks are doomed to fail (like they did in 2000, red arrows).
The above chart was published in January in the 2021 S&P 500 Forecast, but to put things into perspective and oust false reasoning, it came with the chart below.
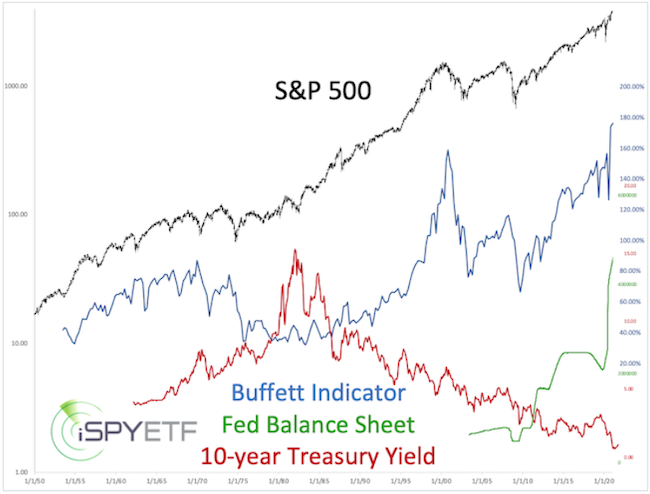
The added red and green graphs show that interest rates have never been lower and liquidity has never been higher. This means that - unlike in 2000 and other times when stocks were deemed over-valued - there is a ton of money slushing around without any high-interest alternatives to stocks.
The conclusion at the time was that: "Valuations (when considered in the big picture context) do not preclude further gains, a meltup or manic phase."
We haven't spent much time looking at Elliott Wave Theory (EWT) simply because it hasn't worked. Nevertheless, every full-year S&P 500 Forecast includes the most likely EWT scenario. Here is the #1 scenario published back in January.
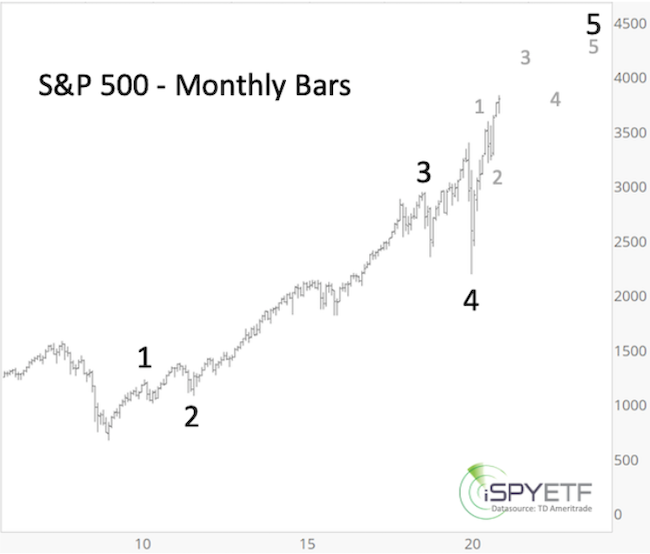
The S&P 500 has reached and exceeded the 4,500 target but the EWT wave count does not look complete yet.
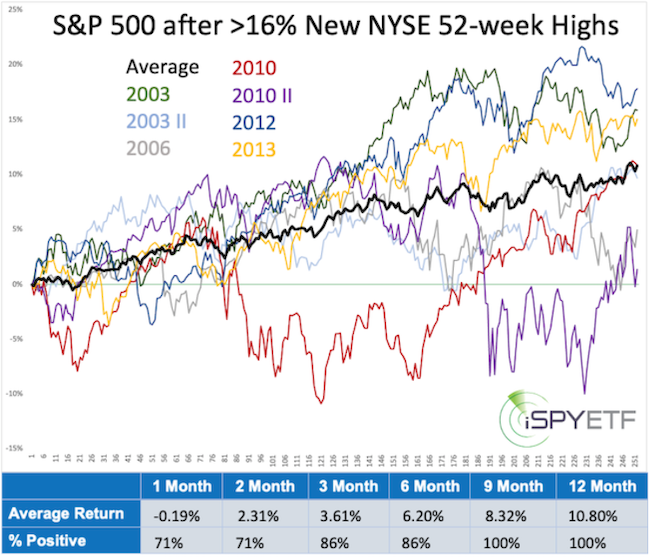
Throughout 2021, we've had a number of studies that showed impeccable forward returns. Below is one published in the May 9, 2021 Profit Radar Report.
Back then, 16.58% of NYSE-trade stocks were at 52-week highs. After the 7 other times this happened, the S&P 500 was higher 9 and 12 months later every time (see performance tracker at bottom of chart).
This newsletter wouldn't be complete without the most important factor to consider: Momentum.
The July 5 Profit Radar Report featured, what I dubbed, the monster momentum study. Copied below is a large chunk of the July 5 Profit Radar Report:
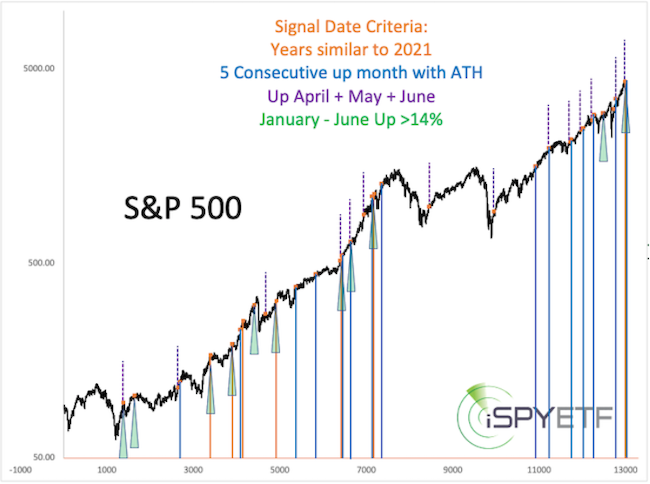
For the first 6 months of 2021, the S&P 500 gained 14.4%, set 36 new all-time highs, has not suffered a pullback of more than 5%, and closed higher for the months of February, March, April, May, June.
For the purpose of finding past precedents, we’ve identified dates that meet at least one of the following four criteria:
- Most persistent first half of the year rallies (gains, number of highs, lack of pullbacks)
- 5 consecutive up months to an all-time high
- Up April, May, June
- End of June gain of >14%
In total there were 45 signal dates. Some of the dates qualified for multiple categories so we ended up with a solid sample size of 35 unique signal dates since 1970.
The first chart provides a broad visual overview over the type of signals (categorized into 4 groups) and when they occurred.
The second chart graphs the S&P 500 forward performance for the year following each signal date. The color of the forward performance graph correlates to the signal color used in the first chart.
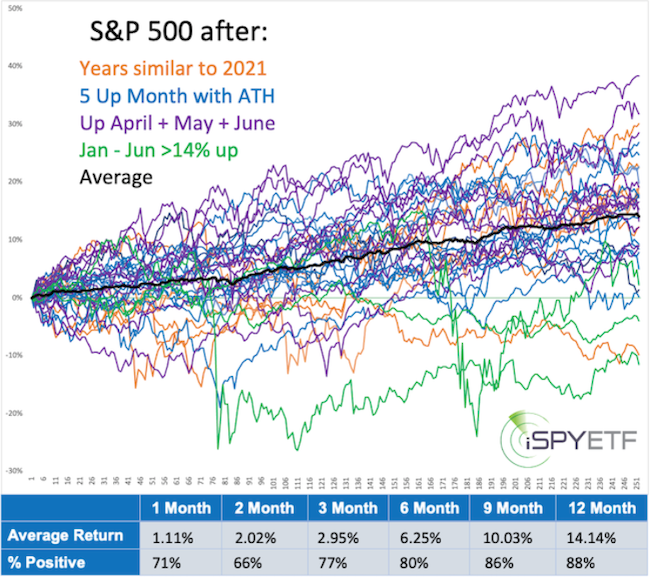
Even though the graph looks busy it has an unmistakable message, one we’ve shared many times: Momentum does no die easily. Based on this comprehensive study the question is not whether to buy/hold but when to buy.
The Profit Radar Report conducts hundreds of studies like the ones above and builds a Risk/Reward Heat Map based on the attained forward returns. The Risk/Reward Heat Map is the most comprehensive, objective, data-based forecasting tool available.
Continued updates, out-of-the box analysis and forward performance based on historic precedents (Risk/Reward Heat Map) are available via the Profit Radar Report.
The Profit Radar Report comes with a 30-day money back guarantee, but fair warning: 90% of users stay on beyond 30 days.
Barron's rates iSPYETF a "trader with a good track record," and Investor's Business Daily writes "Simon says and the market is playing along."
|
