Stocks are caught between a rock and a hard place.
On one hand, there’s the ‘need’ for a new low (more about why this is a ‘need’ in a moment). On the other hand, there’s a bullish reversal (selling climax), a breadth thrust, and an open chart gap (about 7% higher) that needs to get filled.
Who will win this tug of war? Bulls or bears?
Bullish Factors
Reversal Week: The S&P 500 painted a weekly reversal candle on January 22. The January 24 Profit Radar Report pointed out that: “All but one weekly reversals since mid-2013 were followed by at least another week of gains.”
Last week’s strong performance locked in the second week of gains. More details about the significance of weekly reversals (especially after a 52-week low) is available here: Spike in Selling Climaxes Leads to S&P 500 Reversal Week
Chart Gap: There is an open chart gap at 2,043. Since 2009, all open chart gaps have been closed. This one is unlikely to be different. At some point in 2016, the S&P will take care of this unfinished business.
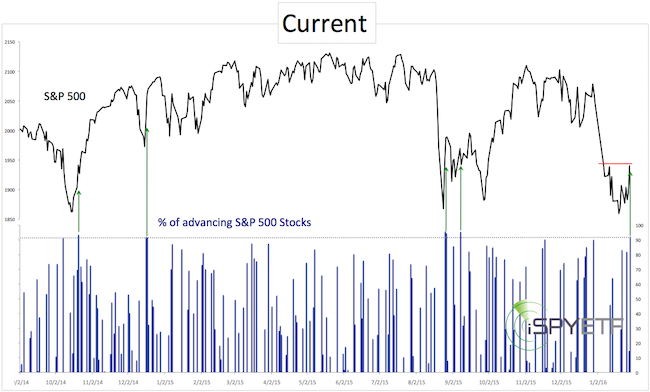
Breadth Thrust: Last Friday (January 29), the S&P 500 soared 2.42%. 92% of S&P 500 stocks ended that day with gains. This was the strongest up day since September 8, 2015.
In theory, 90% up days, are an indication that buyers are ready to step up and drive price higher. But theory is not always reality.
The chart below marks all recent 92% up days. The two 92% up days during the V-shaped recoveries of 2014 led to new all-time highs. The two 92% up days in August/September 2015 were followed by a retest of the prior low.
The January 24 Profit Radar Report outlined this path for the S&P 500 (solid yellow projection more likely, dashed yellow projection less likely).
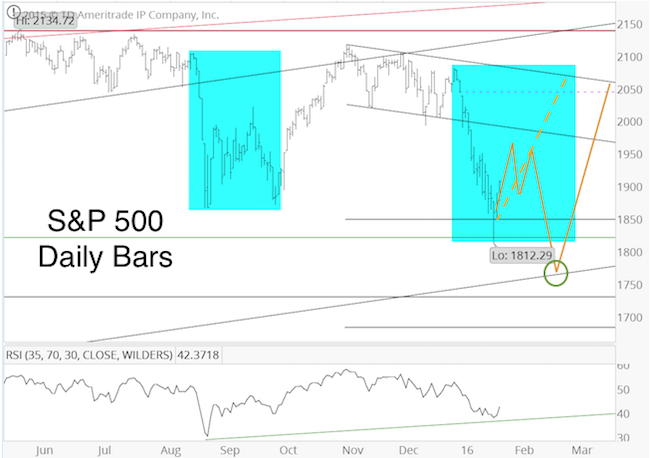
Thus far, the S&P is following the projection quite closely.
If you enjoy quality, hand-crafted research, >> Sign up for the FREE iSPYETF Newsletter
Does the January 29 breadth thrust conflict with the solid yellow projection? No.
Bearish Factors
As the chart below shows, there were numerous 92%+ breadth thrusts in August/September 2011, which closely resembles the yellow projected show above. The S&P eventual dipped below its initial panic low.
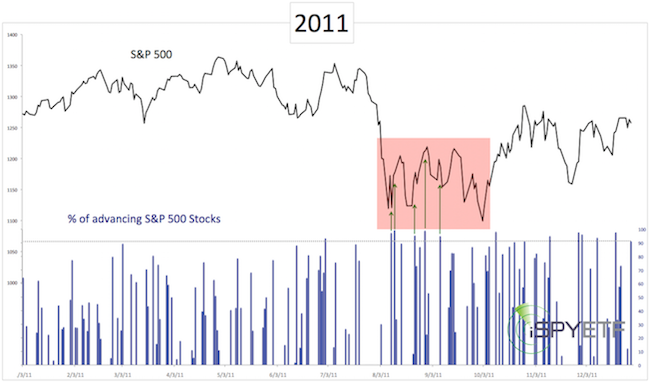
Why are we looking at the 2011 chart?
-
This was the last 10%+ correction.
-
It’s been more than three years since the S&P had a 2011-style correction (2012 was the last time), where the initial panic low is broken after weeks of sideways W action.
Throught 2013 and 2014 we've only seen V-shaped recoveries. The August/September 2015 correction was W-shaped without break of the initial panic low.
This doesn’t mean a 2011 correction (W-shaped with break of the initial panic low) has to happen now, but based on the principal of alternation (the stock market rarely delivers the same pattern over and over), the odds of a 2011-style correction are higher than before.
New lows against bullish divergences would likely be a good opportunity to buy. We are always looking for low-risk entry levels, thus the ‘need’ for new lows.
The 2016 S&P 500 Forecast has just been published. It includes a detailed analysis of supply & demand, technicals, investor sentiment, seasonality, cycles & patterns. The forecast answers whether a major top is in or not, and shows the maximum up-and down side for 2016. Numerous unique data points are combined to craft an actual 2016 S&P 500 performance projection chart. The 2016 S&P 500 Forecast is available to subscribers of the Profit Radar Report. Subscribe now and become the best-informed investor you know.
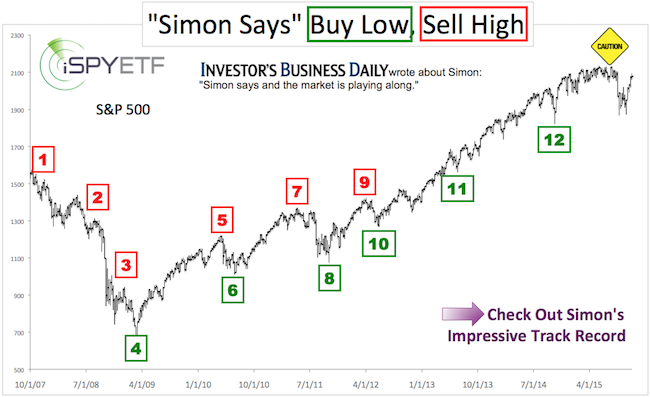
Simon Maierhofer is the publisher of the Profit Radar Report. The Profit Radar Report presents complex market analysis (S&P 500, Dow Jones, gold, silver, euro and bonds) in an easy format. Technical analysis, sentiment indicators, seasonal patterns and common sense are all wrapped up into two or more easy-to-read weekly updates. All Profit Radar Report recommendations resulted in a 59.51% net gain in 2013, 17.59% in 2014, and 24.52% in 2015.
Follow Simon on Twitter @ iSPYETF or sign up for the FREE iSPYETF Newsletter to get actionable ETF trade ideas delivered for free.
If you enjoy quality, hand-crafted research, >> Sign up for the FREE iSPYETF Newsletter
|
