Considering the political cross currents, the S&P 500 has been acting surprisingly normal, even predictable.
In terms of support and resistance levels, the S&P has stopped and accelerated pretty much exactly where it ‘was supposed to.’
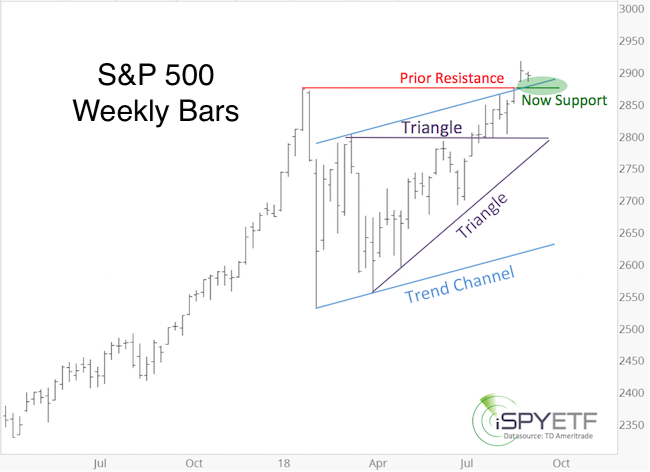
The weekly S&P 500 chart below highlights 3 different support/resistance levels.
-
Triangle with support at 2,800
-
January high resistance at 2,873
-
Trend channel with current support at 2,878
Past Interaction with Support/Resistance Levels
The daily S&P 500 chart shows that triangle resistance at 2,800 served as resistance (red dots) until mid-July. The July 15 Profit Radar Report highlighted this scenario: “The S&P is about to break out of a multi-month triangle with an up side target above 3,000.”
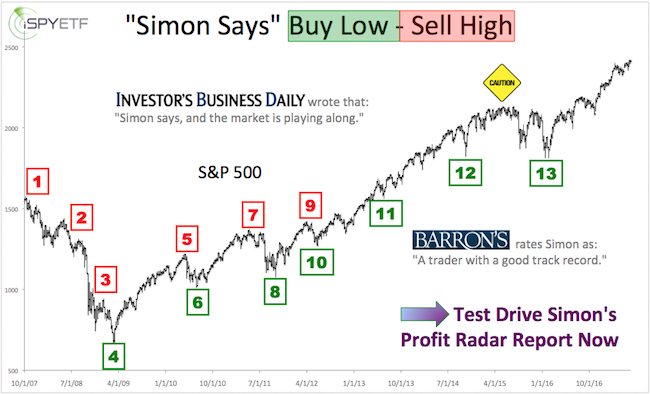
Barron's rates iSPYETF as "trader with a good track record" and Investor's Business Daily says: "When Simon says, the market listens." Find out why Barron's and IBD endorse Simon Maierhofer's Profit Radar Report.
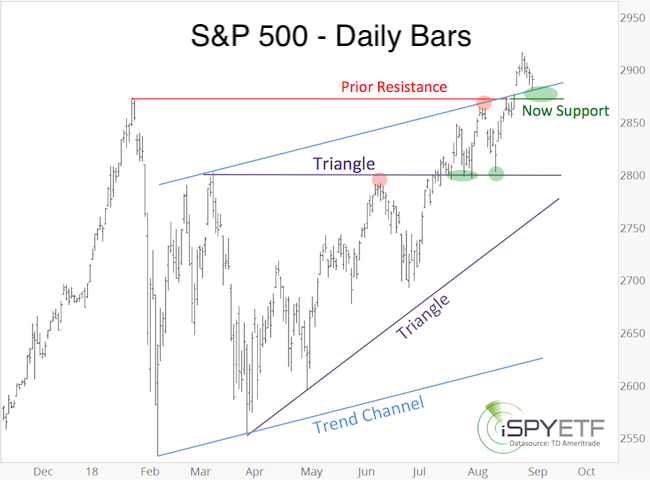
Following the breakout at 2,800, resistance turned into support, and the S&P tested (now) support at 2,800 multiple times (green dots and ovals) before moving on to the next resistance formed by the blue trend channel and the January high (2,865 – 2,875).
Future Interaction with Support/Resistance Levels
Initially the S&P was rejected by resistance at 2,865 – 2875, this led to a test of support at 2,800. Eventually trade popped above 2,875, and made it as high as 2,916.
As before, prior resistance (2,875 – 2,865) is now support, and the August 29 Profit Radar Report wrote that: “It would be normal for the S&P 500 to test its breakout level around 2,875.”
The S&P tested 2,875 today, and as long as it stays above support, odds favor another rally leg.
If you enjoy quality, hand-crafted research, >> Sign up for the FREE iSPYETF Newsletter
Sustained trade below 2,875 will put bullish bets on hold.
The above analysis is based on simple support and resistance levels. The Profit Radar Report enhances basic common sense analysis with other trusted indicators – such as liquidity, sentiment, and seasonality & cycles – to increase the odds of winning trades.
Continued updates are available via the Profit Radar Report.
Simon Maierhofer is the founder of iSPYETF and the publisher of the Profit Radar Report. Barron's rated iSPYETF as a "trader with a good track record" (click here for Barron's profile of the Profit Radar Report). The Profit Radar Report presents complex market analysis (S&P 500, Dow Jones, gold, silver, euro and bonds) in an easy format. Technical analysis, sentiment indicators, seasonal patterns and common sense are all wrapped up into two or more easy-to-read weekly updates. All Profit Radar Report recommendations resulted in a 59.51% net gain in 2013, 17.59% in 2014, 24.52% in 2015, 52.26% in 2016, and 23.39% in 2017.
Follow Simon on Twitter @ iSPYETF or sign up for the FREE iSPYETF Newsletter to get actionable ETF trade ideas delivered for free.
|
