The Russell 2000 (RUT) and Dow Jones Transportation Average (DJT) racked up some pretty significant losses since their 2015 all-time highs.
From the 2015 peak to the 2016 trough, the RUT lost as much as 27.23%, DJT as much as 31.22%. The S&P 500 lost ‘only’ 15.20%.
It was the prevailing opinion for much of 2015 and early 2016 that the RUT and DJT would lead U.S. stocks into the next bear market.
It is correct that small cap underperformance is one of the stages of an aging bull market, and in line with our analysis (view 3 Stages of a ‘Dying’ Bull Market). However, the timing for an immediate bear market didn’t seem right.
The February 11 Profit Radar Report listed six reasons why stocks are likely to rally. The ‘six reason buy signal’ is also discussed here.
After almost three weeks of rising prices (RUT up 11%, DJT up 17%), the RUT and DJT have arrived at their first inflection point.
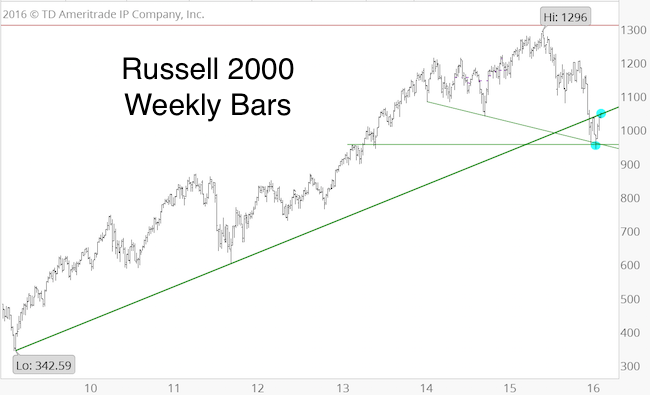
Russell 2000 (RUT)
The RUT is back-testing the ascending green trend line (currently at 1,045), which originates at the March 2009 low. Sustained trade above this trend line is bullish until the signal is reversed.
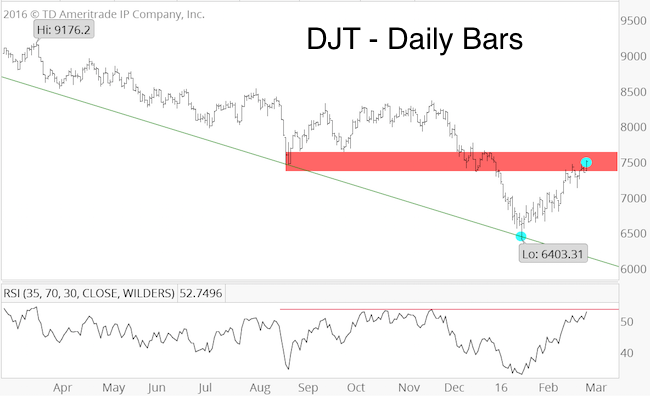
Dow Jones Transportation Average (DJT)
The DJT is threatening to break above the 7,400 – 7,500 zone. This zone served as support a few months ago.
If you enjoy quality, hand-crafted research, >> Sign up for the FREE iSPYETF Newsletter
This is not only price resistance for DJT, it’s also momentum resistance as DJT’s prior rallies failed at similar RSI readings.
Conclusion
When the Profit Radar Report issued a buy signal at S&P 1,828, it wasn’t clear whether this rally would only move to the initial up side target at 1,950 or beyond.
Based on investor sentiment, there was a distinct chance that a runaway rally (with higher targets) would develop.
The S&P is not in the clear yet, but the RUT and DJT charts may help gauge the broad market’s prospects. RUT and DJT above their respective resistance levels is a positive for the S&P and other indexes.
Simon Maierhofer is the publisher of the Profit Radar Report. The Profit Radar Report presents complex market analysis (S&P 500, Dow Jones, gold, silver, euro and bonds) in an easy format. Technical analysis, sentiment indicators, seasonal patterns and common sense are all wrapped up into two or more easy-to-read weekly updates. All Profit Radar Report recommendations resulted in a 59.51% net gain in 2013, 17.59% in 2014, and 24.52% in 2015.
Follow Simon on Twitter @ iSPYETF or sign up for the FREE iSPYETF Newsletter to get actionable ETF trade ideas delivered for free.
If you enjoy quality, hand-crafted research, >> Sign up for the FREE iSPYETF Newsletter
|
