Based on Bloomberg data, an unknown trader paid almost $13 million to buy VIX call options.
Options provide leverage not available via ETFs or ETNs like the iPath S&P 500 Futures ETN (NYSEArca: VXX) or VelocityShares 2x VIX ETF (NYSEArca: TVIX).
This is a bold bet for a number of reasons:
-
The trade will only be successful if the VIX rallies at least 56%.
-
Contango incrementally and persistently eats away at long VIX trades (see below for explanation of VIX contango).
-
The VIX broke below support at 12. The May 18 Profit Radar Report stated that: "Key support for the VIX is at 12. A move below 12 would suggest further up side for stocks."
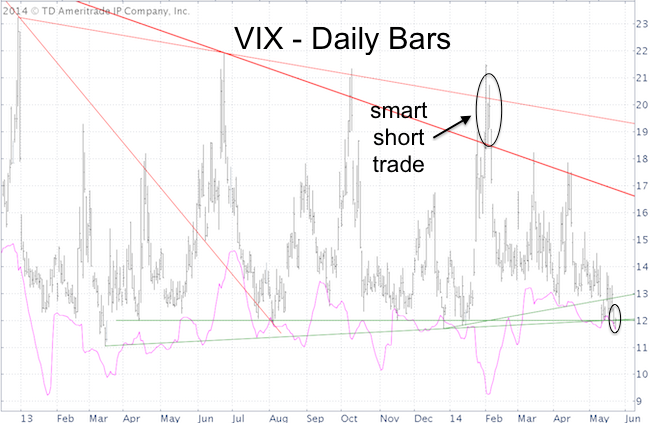
At the beginning of the year, on January 28, an unknown trader placed an even bigger $18 million bet on a falling VIX. At the time the VIX traded around 19.
In an article titled: “Record Bet: Trader Sells $18 Million in VIX Calls,” I outlined three reasons why this was a smart bet.
-
As the January 28 Profit Radar Report highlighted, VIX resistance was at 18.60 – 20.20. Going short against resistance always provides a low-risk entry (assuming a stop-loss is set above resistance).
-
Contango: Contango provides head wind against bullish bets, but tail wind for bearish bets (click above link for detailed explanation of contango, and how much profit it erodes each day) .
-
S&P 500 lows are often accompanied by VIX divergences, which means that the VIX often does not spike to new highs even if the S&P 500 (NYSEArca: SPY) drops to new lows.
Obviously, the bearish $18 million bet in January paid off handsomely. I don’t think the odds of this bullish VIX trade paying off are as good.
VIX seasonality has not yet bottomed and projects even lower readings. The VIX seasonality chart pinpoints the seasonal bottom and best time to buy the VIX.
More information along with the only free and updated VIX seasonality chart on the web is available here:
The Only Free and Updated VIX Seasonality Chart
Simon Maierhofer is the publisher of the Profit Radar Report. The Profit Radar Report presents complex market analysis (S&P 500, Dow Jones, gold, silver, euro and bonds) in an easy format. Technical analysis, sentiment indicators, seasonal patterns and common sense are all wrapped up into two or more easy-to-read weekly updates. All Profit Radar Report recommendations resulted in a 59.51% net gain in 2013 and 17.59% in 2014.
Follow Simon on Twitter @ iSPYETF or sign up for the FREE iSPYETF Newsletter to get actionable ETF trade ideas delivered for free.

If you enjoy quality, hand-crafted research, >> Sign up for the FREE iSPYETF Newsletter
|
