Yes, this is a pretty bold headline, but it’s not just a sensationalistic attention grabber, it’s simply the result of my research.
I published a similar article before in February 2016, when the S&P 500 traded below 1,900. The title then was: 2016 Bear Market Risk is Zero Based on this Rare but Consistent Pattern
In fact, a pattern similar to February 2016 played out in January of this year (discussed here: Is the ‘Bear Market’ Already Over?)
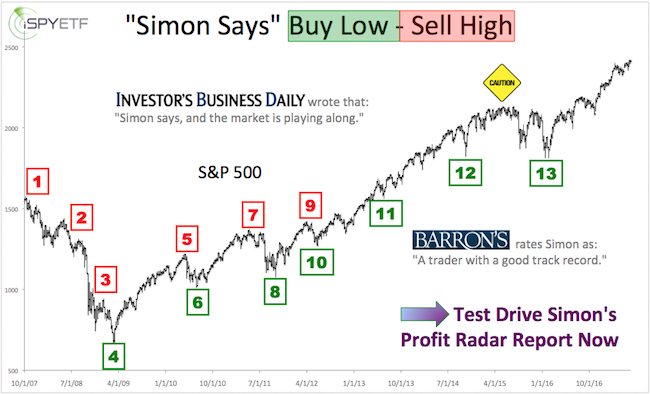
Barron's rates iSPYETF as "trader with a good track record" and Investor's Business Daily says: "When Simon says, the market listens." Find out why Barron's and IBD endorse Simon Maierhofer's Profit Radar Report.
But the reason for this bullish long-term article is the new S&P 500 all-time high, not a breadth thrust from the low (as in February 2016 and January 2019). Here is why this is bullish:
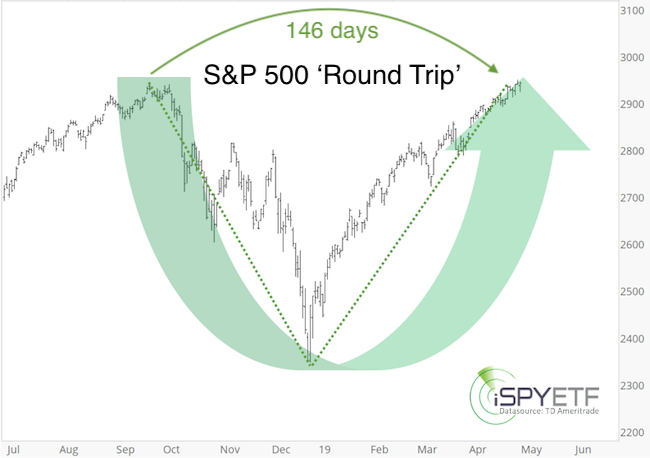
Bullish ‘Round Trip’
Last week’s new S&P closing high completed a tumultuous round trip: A 20% drop sandwiched by two all-time highs in 146 days (see chart below).
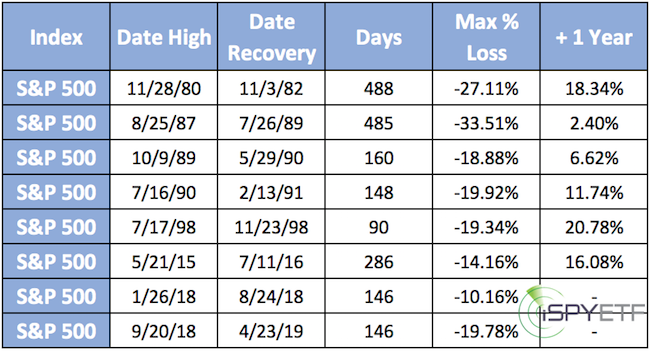
Since 1928, something similar (at least a 14% drop sandwiched by all-time highs) has only happened 12 other times, 6 of those occurred since 1980 and are listed in the table below (the table includes the 2018 round trip, although it was only 10.16%).
‘Round Trip’ Implications
The stat is interesting, but does it mean anything? Yes, it does.
As the right column (table above) shows, 1 year after the S&P eclipsed its prior all-time high, it was higher every time, on average 12.66%.
If you enjoy quality, hand-crafted research, >> Sign up for the FREE iSPYETF e-Newsletter
The chart below shows the average performance for the year following the day when the S&P 500 fully recovered its prior losses (based on the data shown in table).
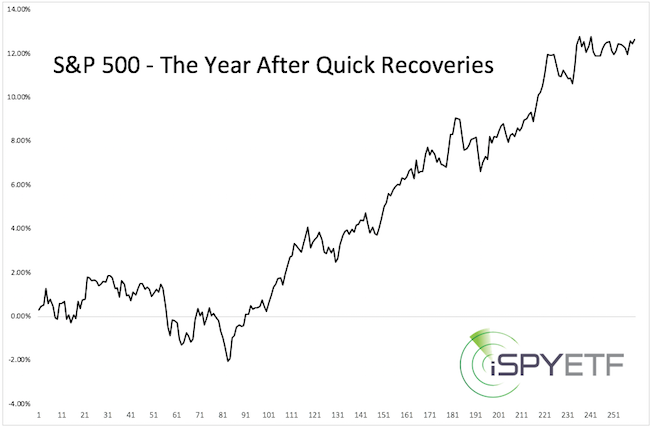
Based on the average trajectory, the first 80 trading days (about 4 month) after the all-time high tended to be choppy, but price action is outright bullish thereafter.
Odds of a deep but temporary S&P 500 pullback from the 2,950 - 3,000 range are high.
Price studies like this are just one of many indicators that go into the Profit Radar Report’s market forecasts. If you have only a few minutes every week to become the best-informed investor you know, you’ll enjoy the Profit Radar Report. Take a test drive now.
Simon Maierhofer is the founder of iSPYETF and the publisher of the Profit Radar Report. Barron's rated iSPYETF as a "trader with a good track record" (click here for Barron's evaluation of the Profit Radar Report). The Profit Radar Report presents complex market analysis (S&P 500, Dow Jones, gold, silver, euro and bonds) in an easy format. Technical analysis, sentiment indicators, seasonal patterns and common sense are all wrapped up into two or more easy-to-read weekly updates. All Profit Radar Report recommendations resulted in a 59.51% net gain in 2013, 17.59% in 2014, 24.52% in 2015, 52.26% in 2016, and 23.39% in 2017.
|