In late June we temporarily simplified our approach to market forecasting. Why? Every major index did its own thing. This non-sexy, but effective approach was explained here.
The June 29 Profit Radar Report stated that: “As long as the S&P 500, Nasdaq and NYSE Composite remain above support (particularly 2,400 for the S&P), we will allow for another bounce.”
Barron's rates iSPYETF as "trader with a good track record" and Investor's Bussines Daily says "When Simon says, the market listens." Find out why Barron's and IBD endorse Simon Maierhofer's Profit Radar Report.
The S&P 500 never dipped below support … and is at new all-time highs. The Nasdaq-100 is also at new highs, and seriously overbought. Is it time to worry?
Most Transparent
Interestingly, the Nasdaq-100 pattern (as represented by the QQQ ETF) has offered the most discernable pattern.
After the massive June 9 red candle (which occurred red at Fibonacci resistance – 143.55) ), the Profit Radar Report stated: “The Nasdaq-100 painted a bearish reversal candle today. Every red candle high (since October 2013) saw lower prices at some point over the next 1-2 weeks. Next support is at 137.20 and 135.70.”
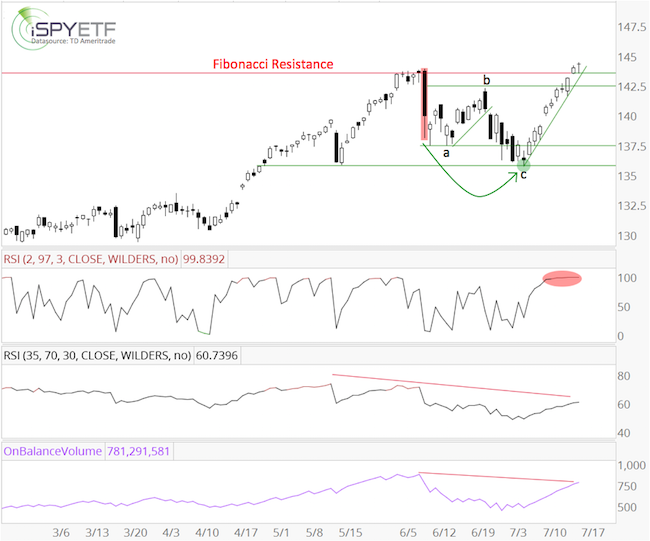
4 weeks later, QQQ arrived at 135.70, and the July 9 Profit Radar Report pointed out that: “The a-b-c decline unfolded as projected, and at Thursday’s low, the QQQ may potentially have finished wave c down. A bounce/rally seems likely.”
Seriously Overbought
Fast forward another 2 weeks (and 6.2%) and QQQ is once again at new all-time highs.
If you enjoy quality, hand-crafted research, >> Sign up for the FREE iSPYETF Newsletter
Although trade has made it above Fibonacci resistance (now support), based on RSI-2 the Nasdaq is seriously overbought with a bearish RSI-35 divergence. Trading volume on up days has been lighter than on down days, which is reflected in the bearish on balance volume divergence.
Perfect Storm (or Tempest in Teapot?)
Additionally, the S&P 500 is nearing our long-standing up side target (2,500+/-) set a year ago.
The comprehensive stock market update explains why we don’t expect a major correction (yet), but now is not the time to chase stocks. Protecting profits and perhaps taking a stab at some LOW-RISK short positions seems appropriate.
Continued analysis along with low-risk trade setups are available via the Profit Radar Report.
Simon Maierhofer is the founder of iSPYETF and the publisher of the Profit Radar Report. Barron's rated iSPYETF as a "trader with a good track record" (click here for Barron's profile of the Profit Radar Report). The Profit Radar Report presents complex market analysis (S&P 500, Dow Jones, gold, silver, euro and bonds) in an easy format. Technical analysis, sentiment indicators, seasonal patterns and common sense are all wrapped up into two or more easy-to-read weekly updates. All Profit Radar Report recommendations resulted in a 59.51% net gain in 2013, 17.59% in 2014, and 24.52% in 2015.
Follow Simon on Twitter @ iSPYETF or sign up for the FREE iSPYETF Newsletter to get actionable ETF trade ideas delivered for free.

If you enjoy quality, hand-crafted research, >> Sign up for the FREE iSPYETF Newsletter
|
