The most recent S&P 500 update is available here.
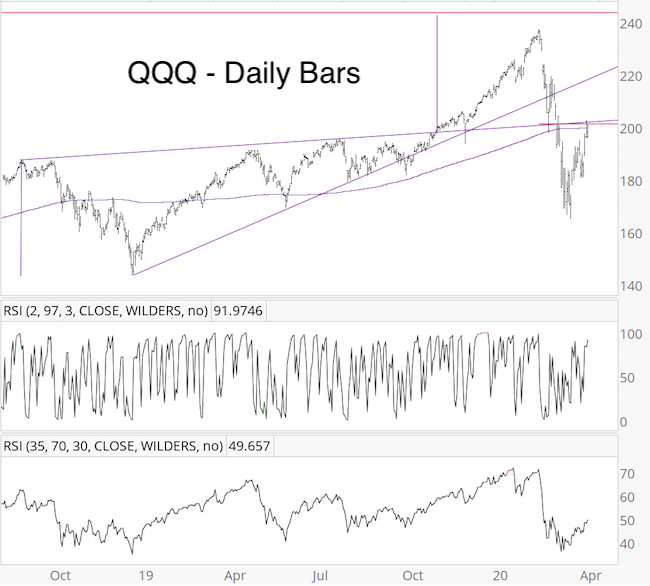
The February 19, 2020 PRR highlighted the Nasdaq-100 and QQQ wedge (purple lines) and stated: “The QQQ chart shows a rising wedge (ascending purple lines), subsequent breakout, and measured target (242.06). Fibonacci projection resistance is at 243.46 (red line), Those levels are 2 - 2.5% above today’s close.”
Barron's rates iSPYETF as "trader with a good track record" and Investor's Business Daily says: "When Simon says, the market listens." Find out why Barron's and IBD endorse Simon Maierhofer's Profit Radar Report.
QQQ missed the measured target for the wedge breakout by a couple percent before falling hard. More interestingly, QQQ is now back at original wedge resistance (around 201), which is reinforced by the 200-day SMA and the 50% Fibonacci retracement level (February 19 high - March 23 low).
If you enjoy quality, hand-crafted research, sign up for the FREE iSPYETF e-newsletter & market outlook
Just a couple of weeks ago, QQQ traded 17% below its 200-day SMA, and now it's above the 200-day SMA, the quickest such recovery ever.
There’ve been 11 other times when QQQ clawed back from a 10% or more drop below its 200-day SMA to above the 200-day SMA rather quickly. The forward returns were inconsistent, but if QQQ relapsed, it tended to happen fairly quickly after the initial bounce back above the 200-day SMA.
In summary, there is a triple support/resistance zone at 200-202 for the QQQ, and how price behaves around this zone may set the stage for the coming days and weeks.
Continued updates, projections, buy/sell recommendations are available via the Profit Radar Report.
Simon Maierhofer is the founder of iSPYETF and the publisher of the Profit Radar Report. Barron's rated iSPYETF as a "trader with a good track record" (click here for Barron's evaluation of the Profit Radar Report). The Profit Radar Report presents complex market analysis (S&P 500, Dow Jones, gold, silver, euro and bonds) in an easy format. Technical analysis, sentiment indicators, seasonal patterns and common sense are all wrapped up into two or more easy-to-read weekly updates. All Profit Radar Report recommendations resulted in a 59.51% net gain in 2013, 17.59% in 2014, 24.52% in 2015, 52.26% in 2016, and 23.39% in 2017.
|