Allow me to tell the painful tale of a perfectly timed short S&P 500 trade. This is a classic example of where doing what is right feels so wrong.
The Short Entry
Via the June 8, Profit Radar Report, I recommended to short the S&P 500. We called this the most promising setup since we bought the S&P at 1,828 on February 11.
Barron's rates iSPYETF as a "trader with a good track record." Click here for Barron's assessment of the Profit Radar Report.
The short entry turned out to be perfectly timed as the market sold off right afterwards.
Ignoring Brexit
Unlike many pundits and analysts, I didn’t participate in the Brexit/Bremain speculation. Why? Trying to predict the unpredictable is a fool’s errand, as the headlines below show:
-
MarketWatch: Bollinger Bands Suggest Stocks Could Break Out in a Big Way
-
Wall Street Journal: U.S. Stocks Rally as Markets Bet on ‘Bremain’
-
Forbes: Stocks Rally with Brexit Looking Unlikely
-
MarketWatch: Stocks close higher as Wall Street bets U.K. Will Vote to Stay in EU
The market proved the above headlines wrong just one day after they were written.
Indictor Toolbox Correctly Foresees Brexit Reaction
In hindsight, it becomes clear that our indicators accurately predicted what was to happen last week (the week of the Brexit vote). Here is outlook published via the June 19 Profit Radar Report:
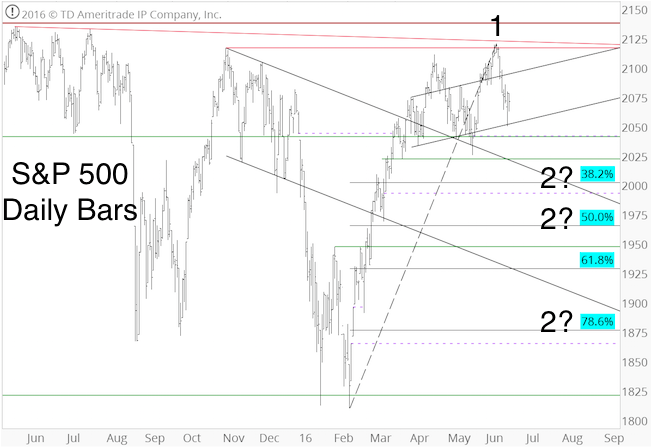
“In terms of seasonality, the week after June Triple Witching has been dismal, down 10 of the past 11 years. Based on Elliott Wave Theor,y the S&P finished 5-waves up to complete wave 1 on June 8 at 2,120.55. Next should be a wave 2 decline. Waves 2 tend to retrace a Fibonacci 50% - 61.8% of the prior move. The ideal target range for a wave 2 correction is 1,970 – 1,925.
However, prior to resuming the down trend, the S&P may bounce to 2,090 - 2,110. It would take a move above 2,121 to unlock a much more bullish wave structure.
Summary: The positive market breadth divergence at Friday’s close suggests the market wants to bounce. Similar bouts of selling in the past have usually led to relief rallies. However, seasonality is bearish for next week. Perhaps we will get a little of both, an early week bounce to 2,090 - 2,110, followed by a late week sell off.”
The chart below (published along with the June 19 Profit Radar Report) highlights the mentioned down side targets.
As it turns out, the market followed the ‘script’ almost perfectly. It rallied the first part of the week, and sold of the last part of the week. However, … there was one big problem.
Only Mention of Brexit
The first and only time the Profit Radar Report mentioned the Brexit vote was on June 22, when it provided a timelime for when the UK vote results would be released.
In short, vote results would be available Friday around 7am GMT, which is 3am EST, which means Wall Street would be closed and subject to massive gap up or down open.
That was the biggest risk for investors and our S&P 500 short position.
The June 12 Profit Radar Report warned of this risk (in correlation with out short position) as follows:
“Our biggest worry is finding the best stop-loss level. The S&P is already nearing an oversold condition as it’s approaching the first support zone, which increases the odds of a bounce. Based on the open chart gaps, a bounce above 2,110 (our entry level is possible).
Worst-case scenario (assuming a stop-loss at 2,110) would be a bounce above 2,110, followed by another leg lower. Based on Elliott Wave Theory, that’ possible. However, raising the stop-loss would increase risk.”
On Wednesday before the vote, two VIX-based indicators registered sentiment extremes that have led to rallies on the past.
On Thursday before the vote, the S&P 500 moved above 2,110. This stopped us out of our short S&P 500 position at breakeven … at the worst possible time.
The next day, the S&P gapped lower and dropped to 2,054 within the first hour of trading. Unfortunately we weren’t on that bus.
Better Safe than Sorry
A couple of decades of managing other’s people money have taught me to always err on the side of caution. Although much of the evidence suggested a resolution to the down side, holding on to the short position overnight would have been closer to gambling than prudent risk management.
Due to the time difference between the UK and the US, and the associated gap up or gap down open, prudent risk management was impossible. Although we'd love to have made money of the post-Brexit meltdown, fortunately the worst-case scenario for us is to be out of the market while many other investors are suffering a big hit on their portfolio.
Still, never has doing the right (the prudent) thing felt so wrong.
Continued S&P 500 analysis is available via the Profit Radar Report.
Simon Maierhofer is the founder of iSPYETF and the publisher of the Profit Radar Report. Barron's rated iSPYETF as a "trader with a good track record" (click here for Barron's profile of the Profit Radar Report). The Profit Radar Report presents complex market analysis (S&P 500, Dow Jones, gold, silver, euro and bonds) in an easy format. Technical analysis, sentiment indicators, seasonal patterns and common sense are all wrapped up into two or more easy-to-read weekly updates. All Profit Radar Report recommendations resulted in a 59.51% net gain in 2013, 17.59% in 2014, and 24.52% in 2015.
Follow Simon on Twitter @ iSPYETF or sign up for the FREE iSPYETF Newsletter to get actionable ETF trade ideas delivered for free.

If you enjoy quality, hand-crafted research, >> Sign up for the FREE iSPYETF Newsletter
|
