At the same time last year, the S&P 500 was in the early stages of a 270-point drop and logged one of the worst Januaries in history.
On January 20, and February 11, the S&P was as low as 1,810. Headlines, such as the one below, sprouted up everywhere (talk about financial bloopers):
-
“Warning: The Stealth Bear Market is About to Show its Teeth” – MarketWatch
-
“Here Comes the Recession and Bear Market” – Forbes
-
“Marc Faber: Assets will Crash like Titanic” – Bloomberg
-
“Soros: It’s the 2008 Crisis all Over Again” – CNBC
-
“Gartman: It’s Definitely a Bear Market this Time” - CNBC
-
“The Bear Market in Stocks has Finally Arrived” – MarketWatch
-
“Market could Go from Bear to Worse” – TheStreet
-
What a difference a year makes.
The chart below plots the S&P 500 against six different investor sentiment gauges. Sentiment has gone from extremely bearish in January/February 2016 (green bar) to extremely bullish today.
Barron's rates iSPYETF as "trader with a good track record" and Investor's Bussines Daily says "When Simon says, the market listens." Find out why Barron's and IBD endorse Simon Maierhofer's Profit Radar Report.
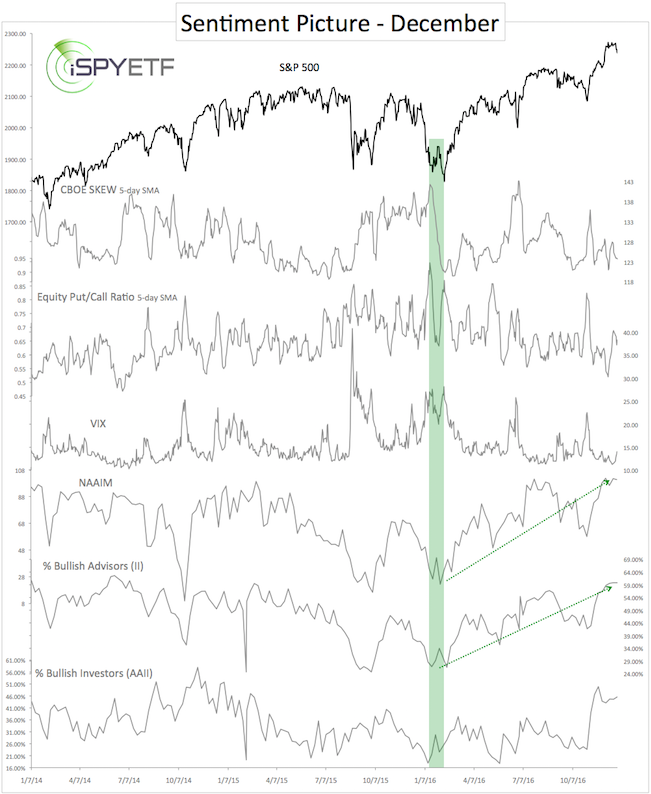
Here is the elephant in the room: From a contrarian perspective, is investor sentiment bullish enough to cause a significant drop right now?
Longer-term Outlook
When viewed in isolation, the answer is: Yes. By some measures, today’s sentiment extremes rival extremes seen in late 2007 (December 31 Profit Radar Report includes a comparison between investor sentiment in 2007 and 2016).
If you enjoy quality, hand-crafted research, >> Sign up for the FREE iSPYETF Newsletter
We never rely on any one single indicator, and other indicators – which predicted this rally before it started - continue to point higher (our longer-term bullish indicators were discussed here: S&P 500 – Expect the ‘Abnormal’ – Comprehensive S&P 500 Analysis).
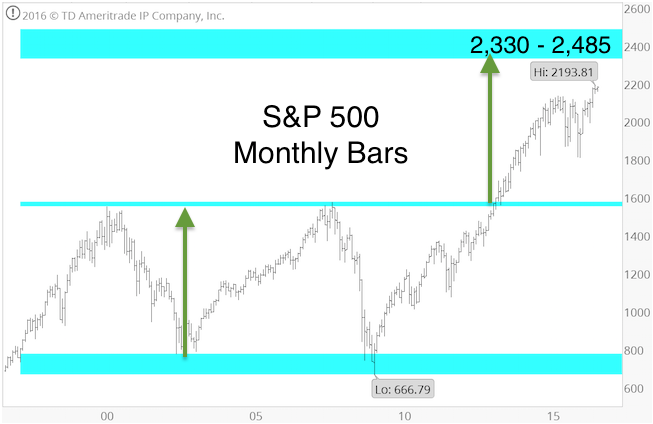
The S&P 500 has yet to reach the up side target published by the August 5 Profit Radar Report (see chart below).
There are times where stocks continue to climb despite sentiment extremes. Now may be such a time.
Short-term Outlook
The December 14 PRR stated that: “Yesterday's high could be the end of wave 3 (perhaps a wave 3 within a larger wave 3), to be followed by a choppy wave 4 correction with much sideways action (sideways action following strong moves has certainly been a pattern in 2016).”
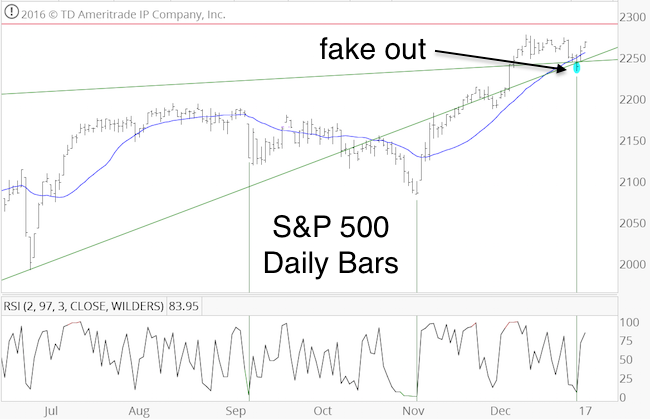
After three weeks of choppy trading, the market did what it does best. It fooled the crowd by briefly dropping below the 20-day SMA and double trend line support at 2,245.
If you enjoy quality, hand-crafted research, >> Sign up for the FREE iSPYETF Newsletter
This drop triggered another set of buy signals for the S&P 500 SPDR ETF (SPY) and Nasdaq QQQ ETF (QQQ), and the January 2 PRR stated that: “The S&P 500 broke below support at 2,245. This may just be a fakeout move. The DJIA, Russell 2000 and Nasdaq are at support. We will allow stocks to regain their footing and move higher from around current levels.”
The strongest part of this rally is behind us, but further gains are still likely. Instead of straight up, future gains will probably take the shape of ‘two steps forward, one step back.’
Continuous updates with actual buy/sell recommendation are available via the Profit Radar Report.
Simon Maierhofer is the founder of iSPYETF and the publisher of the Profit Radar Report. Barron's rated iSPYETF as a "trader with a good track record" (click here for Barron's profile of the Profit Radar Report). The Profit Radar Report presents complex market analysis (S&P 500, Dow Jones, gold, silver, euro and bonds) in an easy format. Technical analysis, sentiment indicators, seasonal patterns and common sense are all wrapped up into two or more easy-to-read weekly updates. All Profit Radar Report recommendations resulted in a 59.51% net gain in 2013, 17.59% in 2014, and 24.52% in 2015.
Follow Simon on Twitter @ iSPYETF or sign up for the FREE iSPYETF Newsletter to get actionable ETF trade ideas delivered for free.

If you enjoy quality, hand-crafted research, >> Sign up for the FREE iSPYETF Newsletter
|
