Is this rally legit or counterfeit? The ‘moment of truth’ is here, and we should soon find out.
How so?
I published the below S&P 500 chart in the June 2 Profit Radar Report and have been watching the purple projection ever since. The expanding purple lines outline a megaphone or expanding triangle pattern, with the upper ascending trend line marking natural resistance.
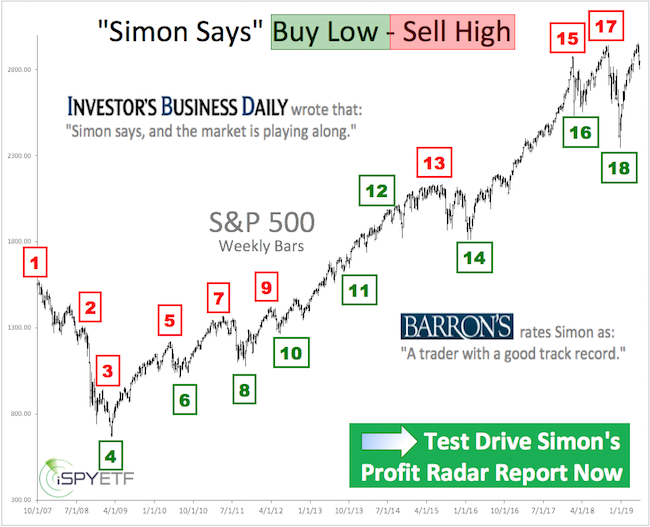
Barron's rates iSPYETF as "trader with a good track record" and Investor's Business Daily says: "When Simon says, the market listens." Find out why Barron's and IBD endorse Simon Maierhofer's Profit Radar Report.
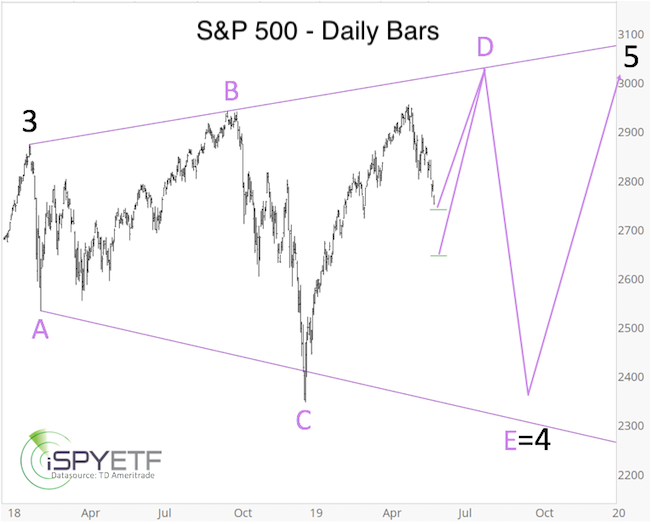
Critics claim that trend lines like this are ‘technical voodoo,’ but the market provides the points, analysts like myself simply connect the dots (like painting by numbers).
Such trend lines are like traffic lights. A car can stop at any given moment, but it’s most likely to stop (and potentially U-turn) at a traffic light.
Rule of thumb
Since trend lines give the market a chance to prove itself, it’s generally best not to buy below trend line resistance (because the market has to prove itself by moving above) or to sell above resistance (because the market just proved it can move above and may continue higher).
If you enjoy quality, hand-crafted research, >> Sign up for the FREE iSPYETF e-Newsletter
What are the odds of a reversal?
The updated S&P 500 chart below includes the same expanding triangle (or megaphone) lines along with some other support/resistance levels and indicators.
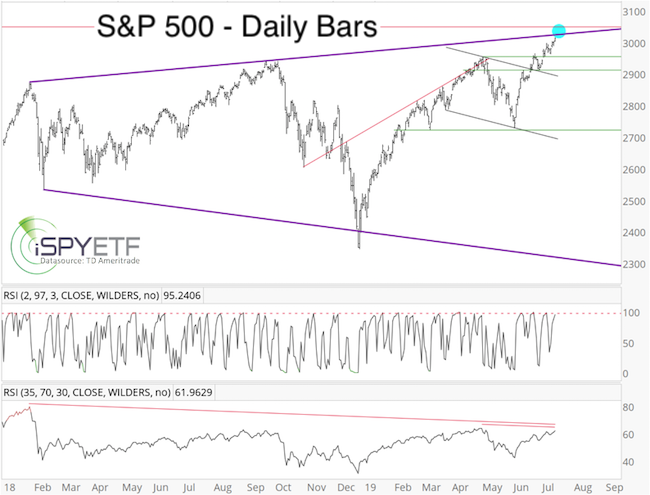
The S&P 500 is within striking distance of trend line resistance. RSI-2 is almost over-bought, and RSI-35 is lagging.
In other words, the S&P is approaching the ‘traffic light’ with the gas tank approaching ‘E.’
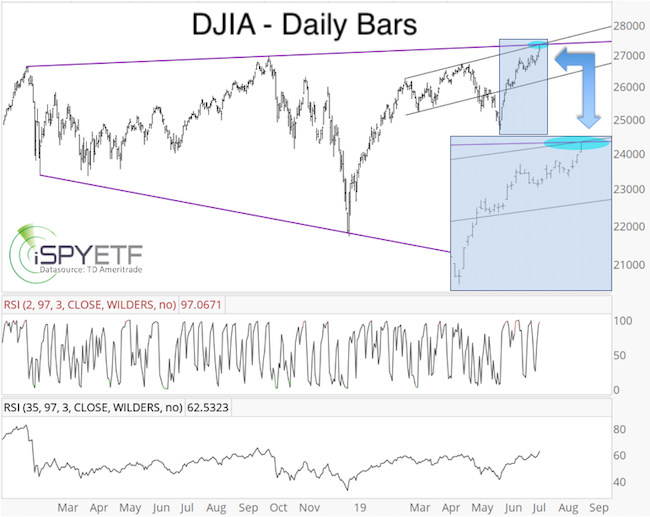
The Dow Jones Industrial Average already tagged its megaphone line. If it moves above, and as long as it stays above, it’s prudent to allow for higher prices, although a number of indicators suggest an eventual relapse.
Seasonality
The beginning of July is usually bullish (with the first trading day of July having been up 84% of the time), but this bullish seasonality is now fading away. In fact, the second half of July and August tend to be tough for stocks.
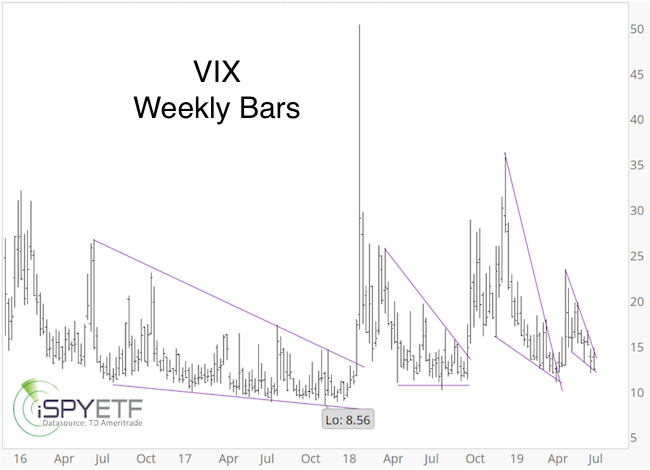
Bearish VIX wedge
The VIX is carving out yet another wedge. The wedge is not necessarily an immediate sell signal for stocks, but a close above 14.50 is bullish for the VIX and likely bearish for stocks.
Summary
The S&P 500 and Dow Jones Industrials Average are at a resistance zone that double as inflection zone (the S&P 500 resistance level is 0.5% higher than the corresponding DJIA level, so we should allow for at least a 0.5% margin).
A sustained break above resistance will likely unlock further gains, but failure to move or stay above resistance may be the beginning of another nasty 10-15% correction
Based on the weight of evidence, I believe the risk of a pullback near current levels is elevated.
Continued updates, projections, buy/sell recommendations are available via the Profit Radar Report.
Simon Maierhofer is the founder of iSPYETF and the publisher of the Profit Radar Report. Barron's rated iSPYETF as a "trader with a good track record" (click here for Barron's evaluation of the Profit Radar Report). The Profit Radar Report presents complex market analysis (S&P 500, Dow Jones, gold, silver, euro and bonds) in an easy format. Technical analysis, sentiment indicators, seasonal patterns and common sense are all wrapped up into two or more easy-to-read weekly updates. All Profit Radar Report recommendations resulted in a 59.51% net gain in 2013, 17.59% in 2014, 24.52% in 2015, 52.26% in 2016, and 23.39% in 2017.
|