Déjà vu. Crude oil prices dropped as much as 24% over the past two months. Does this mean the oil rally is over?
Here is a look at various timeframes and indicators to help answer this question.
Longer-term Analysis
The April 24 Profit Radar Report showed the long-term chart below, and stated:
Barron's rates iSPYETF as a "trader with a good track record." Click here for Barron's assessment of the Profit Radar Report.
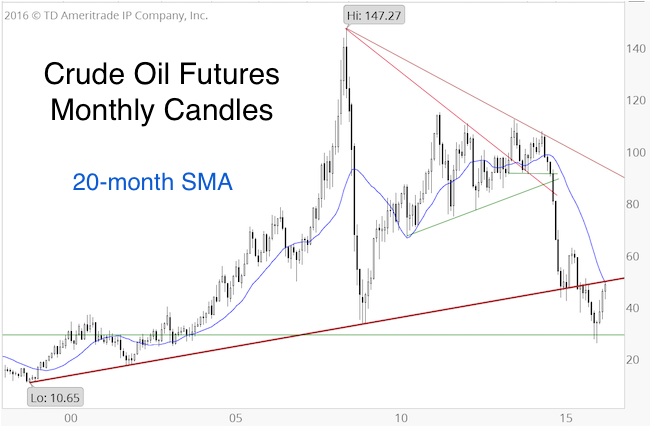
“Based on long-term Elliott Wave Theory, a rally to 50+/- followed by a significant relapse (perhaps even below this year’s low) is a real possibility.”
Over the next six weeks oil tried to move above 50, but ultimately failed.
The July 7 Profit Radar Report noted that: “Seasonality shows a bearish window for the second half of July. Near-term as long as trade remains below 50, and if trade falls below 45.80, bears are in charge. It then remains to be seen whether short-term weakness will turn into a longer-term selloff.”
Shorter-term Analysis
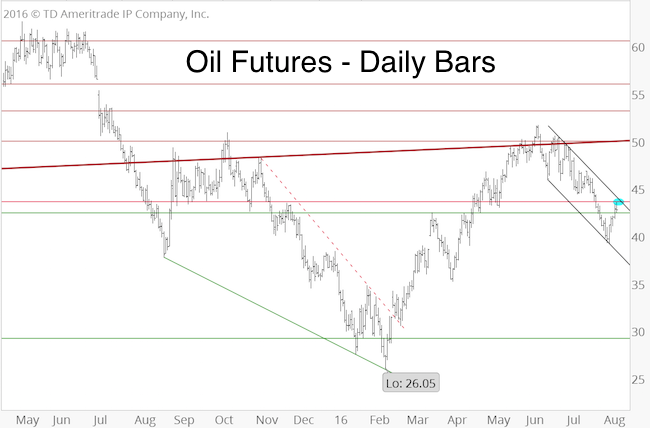
Oil broke (and remains below) 45.80. To better assess the recent selloff, it helps to analyze the rally from the February 2016 low at 26.05.
On February 12, a few days after oil’s bottom at 26.05, the Profit Radar Report stated that: “Crude oil filled the massive gap left by Wednesday spike and is sitting right atop trend line support. Seasonality is strongly bullish until late April. For anyone interested in trading oil, this is a tempting setup to go long.”
If you enjoy quality, hand-crafted research, >> Sign up for the FREE iSPYETF Newsletter
At that time, sentiment, seasonality and technicals suggested a strong rally for oil. However, we did not know if this rally would be a new bull market or just a counter trend rally.
Unfortunately, we still don’t know for sure.
Based on Elliott Wave Theory, the rally from the February low is likely a corrective wave 4 rally. Once complete, all the wave 4 gains should be completely erased (which means new lows eventually).
However, a deeply bearish posture may be premature for a number of reasons:
-
Waves 4 are notoriously choppy and difficult to predict.
-
Oil seasonality is strong until late September.
-
The rally from the February low appears shallow (retracing less than 38.2% of the prior decline). The red lines show additional resistance levels.
Summary
Oil is likely to relapse to new lows eventually. The key word is eventually. Seasonality doesn’t turn bearish until the fourth quarter.
Near-term resistance is around 44. If trade can break above 44, it may continue to move higher, perhaps even to new recovery highs, before turning down for a multi-month decline.
Not every Profit Radar Report update features oil price analysis, but when indicators align, we try to point out some of the larger turning points.
Simon Maierhofer is the founder of iSPYETF and the publisher of the Profit Radar Report. Barron's rated iSPYETF as a "trader with a good track record" (click here for Barron's profile of the Profit Radar Report). The Profit Radar Report presents complex market analysis (S&P 500, Dow Jones, gold, silver, euro and bonds) in an easy format. Technical analysis, sentiment indicators, seasonal patterns and common sense are all wrapped up into two or more easy-to-read weekly updates. All Profit Radar Report recommendations resulted in a 59.51% net gain in 2013, 17.59% in 2014, and 24.52% in 2015.
Follow Simon on Twitter @ iSPYETF or sign up for the FREE iSPYETF Newsletter to get actionable ETF trade ideas delivered for free.

If you enjoy quality, hand-crafted research, >> Sign up for the FREE iSPYETF Newsletter
|
