The last free update (March 2: S&P 500 Reaches Up Side Target – Now What?) pointed out that the S&P 500 reached our up side target, and that risk of a pullback is increasing.
Since March 1, the S&P lost as much as 79 points, the largest drop since last October (followed by a 50-point snap-back rally). Is the correction already over, or are stocks 're-loading' for the next leg down?
The February 20 Profit Radar Report published the chart below with the following ‘worst-case scenario’ assessment:
“Based on Elliott Wave Theory, we anticipate that the S&P is near the end of its wave 3 rally (which started on June 27, 2016 at 1,991.68). Micro-managing the end of wave 3 is probably a fool’s errand, but in attempt to assess the following wave 4 correction potential, lets assume wave 3 ends at 2,405 (red trend line). The common wave 4 retracement is 38.2% (of wave 3), which would present a down side target of 2,247.”
Barron's rates iSPYETF as "trader with a good track record" and Investor's Bussines Daily says "When Simon says, the market listens." Find out why Barron's and IBD endorse Simon Maierhofer's Profit Radar Report.
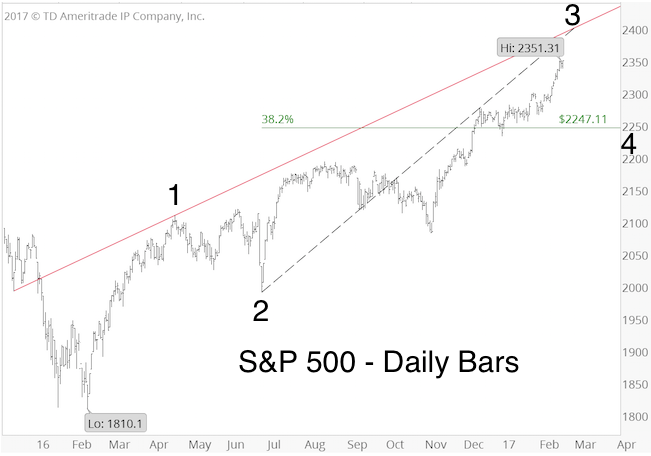
As it turns out, the S&P ran out of fuel at 2,401, not 2,405. Based on the market’s strength, and momentum leading up to the 2,401 high, a drop into the mid 2,200s would be deeper than expected (but a good buying opportunity if it happens).
Are there other down side targets?
If you enjoy quality, hand-crafted research, >> Sign up for the FREE iSPYETF Newsletter
The ‘Peace of Mind’ Trade
The March 26 Profit Radar Report pointed out that the S&P 500 is about to reach the minimum down side target around 2,326 (this was based on Sunday’s overnight selloff), and recommended to buy Monday's gap down open (which ended up being at 2,329).
Why?
Because the S&P 500 reached the minimum down side target, was oversold and showed bullish divergences at Monday’s (March 27) intraday low (Sunday night’s new low in S&P futures also showed a bullish divergence). A bounce was highly likely.
We just didn’t know how big of a bounce it will be.
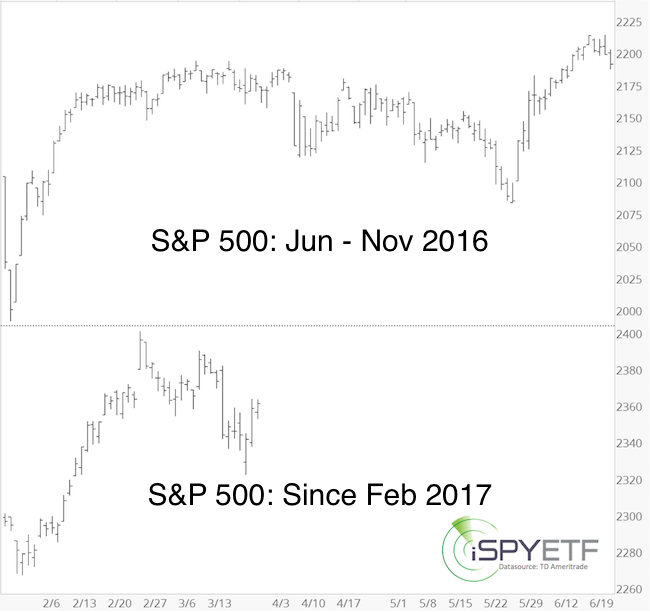
Although another low sometime in April would fit best, it is not necessary. The chart below plots the summer 2016 correction against what we've seen this far for a potential template.
The recommendation to buy at 2,329 on Monday (March 27) was given to provide peace of mind in case stocks continue higher (like they’ve done most of the past eight years).
If the S&P 500 does not fall to new lows in April, we are already long.
If the S&P 500 does drop to new lows, we will be able to buy at lower prices (and ideally sell our long position for a profit or stop out at breakeven to avoid any losses).
We will monitor various breadth and sentiment measures along with technical resistance levels to help determine if/when stocks will relapse.
Buying at lows – although they may prove temporary – eliminates FOMO (Fear Of Missing Out) and the perceived associated need to chase after price.
The next few months will likely increase the need for FOMO trades, as we expect some big moves and hope not to be left behind.
The Profit Radar Report’s 2017 S&P 500 Forecast and twice-a-week regular updates provide short, mid-and long-term forecasts based on various key indicators.
Simon Maierhofer is the founder of iSPYETF and the publisher of the Profit Radar Report. Barron's rated iSPYETF as a "trader with a good track record" (click here for Barron's profile of the Profit Radar Report). The Profit Radar Report presents complex market analysis (S&P 500, Dow Jones, gold, silver, euro and bonds) in an easy format. Technical analysis, sentiment indicators, seasonal patterns and common sense are all wrapped up into two or more easy-to-read weekly updates. All Profit Radar Report recommendations resulted in a 59.51% net gain in 2013, 17.59% in 2014, and 24.52% in 2015.
Follow Simon on Twitter @ iSPYETF or sign up for the FREE iSPYETF Newsletter to get actionable ETF trade ideas delivered for free.

If you enjoy quality, hand-crafted research, >> Sign up for the FREE iSPYETF Newsletter
|
