S&P 500 and Dow Jones price action has been remarkable in many ways. I wanted to find out just how remarkable when viewed in the context of history. Here is how the recent price action stacks up (information below was published in Tuesday's Profit Radar Report):
Barron's rates iSPYETF as "trader with a good track record" and Investor's Business Daily says: "When Simon says, the market listens." Find out why Barron's and IBD endorse Simon Maierhofer's Profit Radar Report
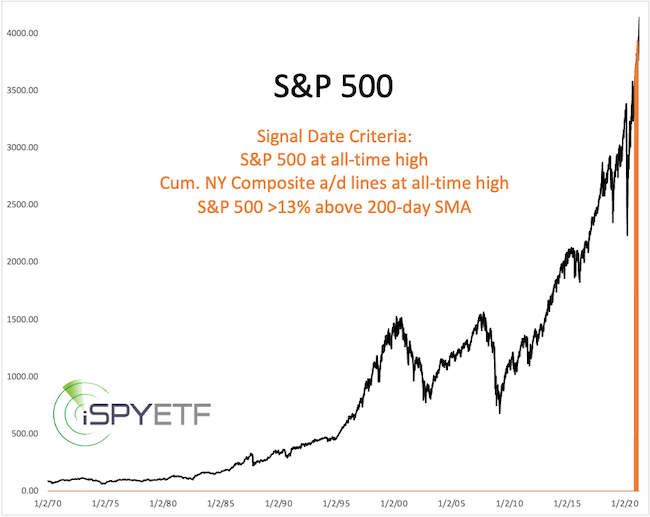
Last Friday, the S&P 500: closed at an all-time high, which was 13.4% above its 200-day SMA, which was confirmed by the cumulative NY Composite advance/decline lines (a measure of liquidity). The same may happen again today. The yellow lines in the first chart below show other times that’s happened. Never (aside from the most recent cluster).
We can't learn much from a sample size of 1, so let's loosen our filter to see how big of a sample size we get.
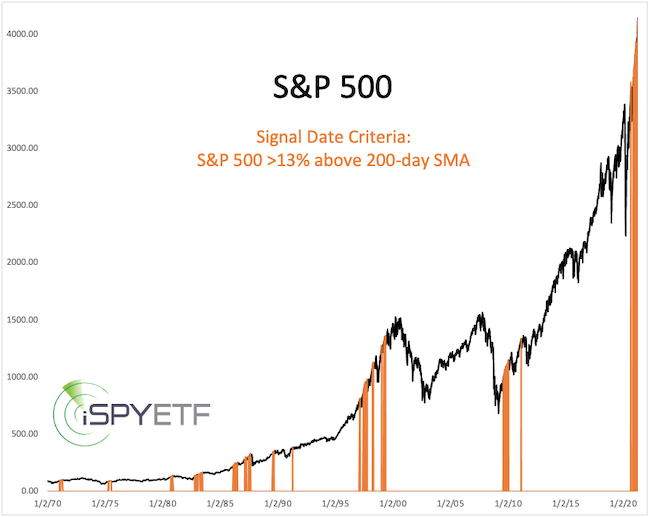
The next chart highlights periods when the S&P 500 closed more than 13% above its 200-day SMA.
Now we have too big of a sample size. If we restrict the criteria to catch only those times when the S&P 500 traded >10% above its 200-day SMA while at an all-time high (confirmed by the cum NYC a/d) we get the following hits.
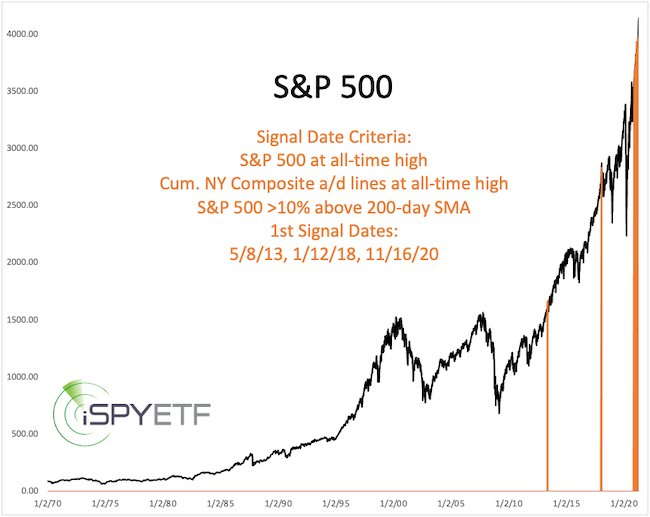
In an attempt to identify breadth readings and price action comparable to current, we’ll now adjust the parameters to show times when the S&P 500 traded >13% above its 200-day SMA while the cum NYC a/d line was at an all-time high. There are only 3 other clusters in the past half century. The first of the most recent signal cluster triggered on 11/16/20.
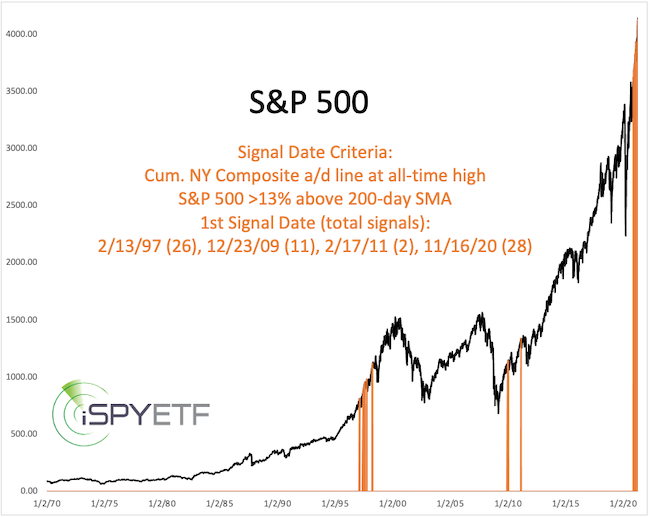
Tuesday's Profit Radar Report shows exactly how the S&P 500 did after the first signal date of each cluster (see above chart). This performance tracker details the S&P 500 forward performance after the signal date via graphs and tables (detailed returns for the next 1, 2, 3, 6, 9, 12 months along with odds of positive returns).
Of course there are other parameters that could be used to assess and compare the current market. Monday's Profit Radar Report, for example, identified other times when more than 90% of stocks trade above both their 50-and 200-day SMA while more than 7% of stocks trade at a 52-week high.
Obviously history does not repeat itself, but it provides insight on how price (which is a reflection of investors, which is based on crowd behavior) reacts in certain situations. Examining historic precedents often reveals recurring patterns useful in assessing what's next.
Continuous updates along with the performance tracker of similar precedents are available via the Profit Radar Report.
Simon Maierhofer is the founder of iSPYETF and the publisher of the Profit Radar Report. Barron's rated iSPYETF as a "trader with a good track record" (click here for Barron's evaluation of the Profit Radar Report). The Profit Radar Report presents complex market analysis (S&P 500, Dow Jones, gold, silver, euro and bonds) in an easy format. Technical analysis, sentiment indicators, seasonal patterns and common sense are all wrapped up into two or more easy-to-read weekly updates.
|