Subscribers to iSPYETF’s free e-mail newsletter receive a market outlook, usually once a week. The market outlook below was sent out on January 27, 2022. If you’d like to sign up for the free e-newsletter, you may do so here (we will never share your e-mail with anyone, just as we don't accept advertising).
There are many ways to measure volatility. Here is one: Just this week alone, S&P 500 Futures have popped and dropped more than 100 points 8 times. Before that, the S&P was down more than 1% on 4 of 6 days while the VIX was up more than 10% on 3 of those 6 days.
Is that kind of volatility more likely to be a bear market kick off signal or a sign of selling exhaustion?
Highlighted below are other times when the S&P 500 lost >1% and VIX rallied >8% on 4 out of 6 days.
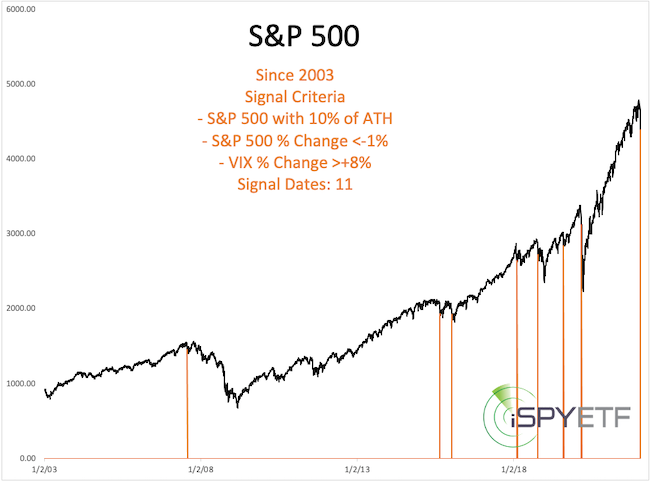
More often than not this particular volatility signal occurred towards the end of a correction or before a bounce, but significantly more damage was done in 2019 and 2020 before the final low.
One of the more remarkable daily reversals happened on Monday, when the S&P 500 quickly lost more than 3% but ended the day in the green, with most of the gains (2%) happening in the last hour.
Shown below are the 7 other times when the S&P rallied more than 2% in the last hour after being down more than 1%.
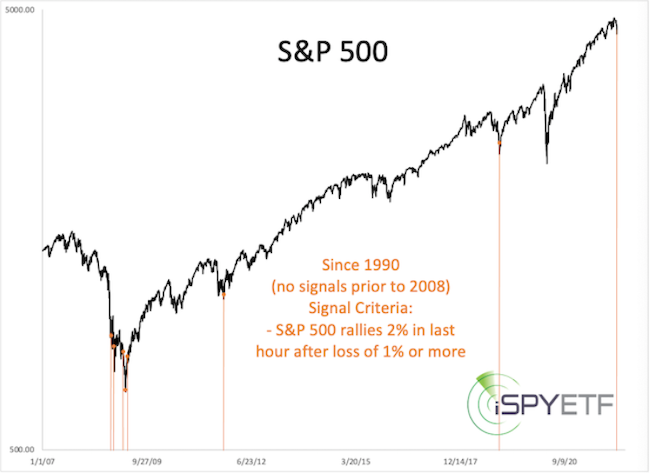
Again, many similar signal dates triggered in the bottoming process, but some saw significant drawdowns before the final low.
Big drawdowns in mid election years (such as 2022) are common. In fact, my 2022 S&P 500 Forecast warned that: "2022 is the mid election year, which is the weakest of the 4-year presidential election year cycle. Historically the S&P 500 declines about 20% into the mid election year low."
Short-term, the January 19 Profit Radar Report stated that: "While below 4,600, the path of least resistance is now down with a possible down side target of 4,300."
4,300 was reached, and will probably have to be amended. Here's why:
It's been rare, but the S&P 500 is actually carving out a discernible Elliott Wave Theory pattern. Based on this pattern, the S&P has declined in 3 waves thus far.
This means the decline could be over, but more likely - in my humble opinion - the S&P will tag on wave 4 (the massive sideways chop since Monday) and wave 5 (new low). If that pattern plays out, I would actually recommend to put some cash to work.
Obviously I'm trying to look around 2 corners but - at this point - new lows should spark at least a tradeable bounce, perhaps more.
My down side target along with out-of-the box historical analysis is available via the Profit Radar Report. In addition, subscribers to the Profit Radar Report also have access to the 2022 S&P 500 Forecast.
The 2022 S&P 500 Forecast examines the key market forces:
- Supply & Demand
- Technicals
- Investor Sentiment
- Seasonality & Cycles
- Risk/Reward Heat Map
- Valuations
and what those market forces tell us about stocks going forward. 21 charts provide invaluable visuals and projections.
The Profit Radar Report comes with a 30-day money back guarantee, but fair warning: 90% of users stay on beyond 30 days.
Barron's rates iSPYETF a "trader with a good track record," and Investor's Business Daily writes "Simon says and the market is playing along."
|
