Crude oil prices almost doubled since the February low. How much higher can oil rally?
The February 21 Profit Radar Report stated that: “Seasonality is strongly bullish until late April. For anyone interested in trading oil, this is a tempting setup to go long.”
Barron's rates the iSPYETF as a "trader with a good track record." Click here for Barron's assessment of the Profit Radar Report.
The April 24 Profit Radar Report added the following: “Based on EWT, more gains are likely, however bullish seasonality is starting to taper off. Sentiment is near neutral. Based on long-term EWT, a rally to 50+/- followed by a significant relapse (perhaps even below this year’s low) is a real possibility.”
If you enjoy quality, hand-crafted research, >> Sign up for the FREE iSPYETF Newsletter
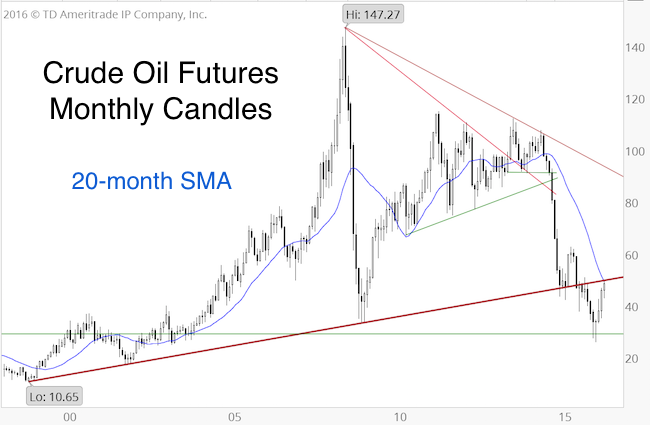
The long-term chart shows why 50+ was the up side target given on April 24 (red long-term trend line + 20-month SMA).
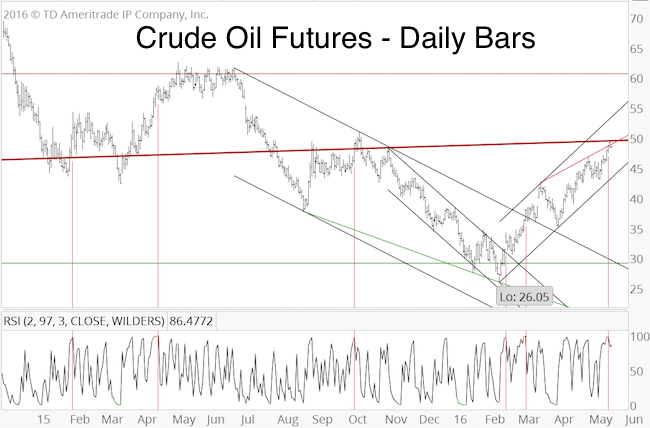
The short-term chart/analysis (featured in yesterday's Profit Radar Report) provides some additional details:
-
Oil moved as high as 49.56 on Tuesday
-
Oil turned overbought on Tuesday (vertical red line)
-
Oil spiked above the shorter red trend line, but closed below it (bearish throw-over)
-
Oil was unable to overcome bold red trend line resistance
All of the above is at least near-term bearish. Although bullish seasonality will reassert itself in June, the trend is lower until double trend line resistance is broken, or bullish divergences emerge at support.
Update (featured in the May 25 Profit Radar Report):
"Oil’s pullback lasted only a couple days, and has now pushed back above the short red-line, attempting to break above the bold red line. This could be a final throwover, but more often than not, persistence around such kind of resistance leads to higher prices."
Simon Maierhofer is the founder of iSPYETF and the publisher of the Profit Radar Report. Barron's rated iSPYETF as a "trader with a good track record" (click here for Barron's profile of the Profit Radar Report). The Profit Radar Report presents complex market analysis (S&P 500, Dow Jones, gold, silver, euro and bonds) in an easy format. Technical analysis, sentiment indicators, seasonal patterns and common sense are all wrapped up into two or more easy-to-read weekly updates. All Profit Radar Report recommendations resulted in a 59.51% net gain in 2013, 17.59% in 2014, and 24.52% in 2015.
Follow Simon on Twitter @ iSPYETF or sign up for the FREE iSPYETF Newsletter to get actionable ETF trade ideas delivered for free.

If you enjoy quality, hand-crafted research, >> Sign up for the FREE iSPYETF Newsletter
|
