Gold has been zigzagging up and down for all of 2017. This erratic performance brings a measure of uncertainty, but – in a way - it also increases confidence in our long-term forecast.
Starting in November 2015, the Profit Radar Report expected a sizeable gold rally.
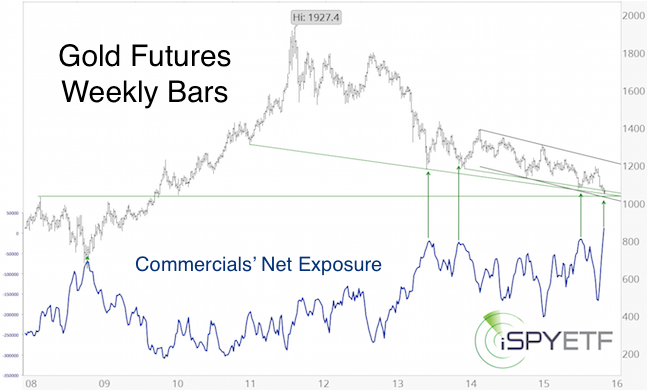
The November 30, 2015 Profit Radar Report published the chart below, which shows gold at quadruple support and record bullish smart money hedgers. An ideal setup for a rally (gold’s final low occurred on December 3, 2015 at 1,045).
The second chart shows the Elliott Wave Theory (EWT) labeling we’ve been following for the past years.
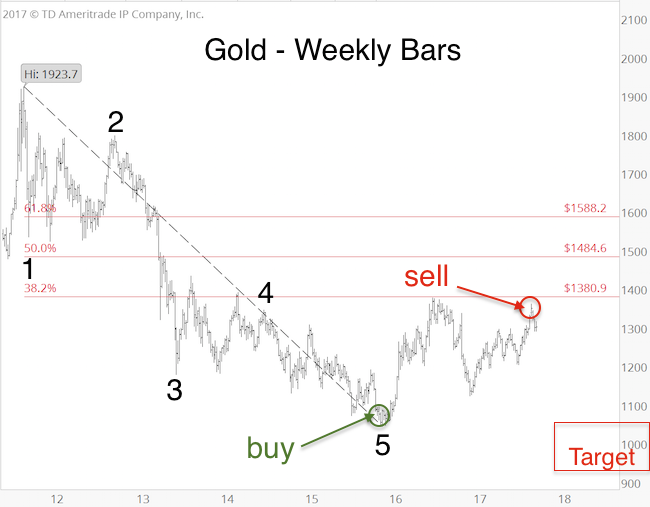
According to EWT, the first wave (comprised of five sub-waves) of the bear market ended in December 2015. The rally since is a counter trend move.
Barron's rates iSPYETF as "trader with a good track record" and Investor's Bussines Daily says "When Simon says, the market listens." Find out why Barron's and IBD endorse Simon Maierhofer's Profit Radar Report.
Common Fibonacci target levels for this counter trend rally are 1,381, 1,485 and 1,588. Counter trends are generally more choppy and less predictable, which is true of the rally from December 2015 to September 2017 (this increases confidence in our forecast).
If you enjoy quality, hand-crafted research, >> Sign up for the FREE iSPYETF Newsletter
Since we were looking for a move above 1,382, the Profit Radar Report issued a buy signal for gold and the SPDR Gold Shares (GLD) in November 2015 (gold at 1,088), and in August 2017 (gold at 1282).
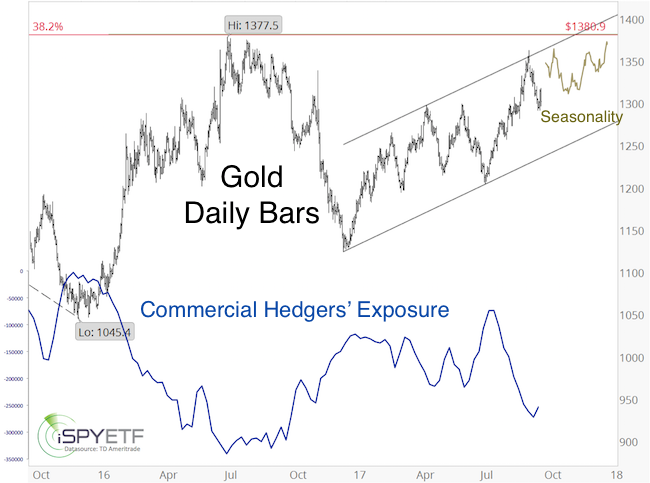
On September 8, 2017 gold became overbought and touched the top of the black trend channel. Smart money hedgers (which were record bullish at the December 2015 low) turned significantly more bearish (see daily chart).
For those reasons, the Profit Radar Report issued a sell signal on September 5, 2017.
We don’t have a down side target for the current pullback (yet), but the lack of a bearish RSI-divergence at the September 8 high and failure to reach or exceed Fibonacci resistance at 1,381 suggests gold will take another stab at new recovery highs.
The daily chart insert illustrates gold seasonality for the remainder of 2017.
The Profit Radar Report will continue to monitor technicals, Elliott Wave patterns, sentiment, seasonality and cycles to confirm (or invalidate) our preferred forecast and spot low-risk buy or sell entries.
Simon Maierhofer is the founder of iSPYETF and the publisher of the Profit Radar Report. Barron's rated iSPYETF as a "trader with a good track record" (click here for Barron's profile of the Profit Radar Report). The Profit Radar Report presents complex market analysis (S&P 500, Dow Jones, gold, silver, euro and bonds) in an easy format. Technical analysis, sentiment indicators, seasonal patterns and common sense are all wrapped up into two or more easy-to-read weekly updates. All Profit Radar Report recommendations resulted in a 59.51% net gain in 2013, 17.59% in 2014, and 24.52% in 2015.
Follow Simon on Twitter @ iSPYETF or sign up for the FREE iSPYETF Newsletter to get actionable ETF trade ideas delivered for free.

If you enjoy quality, hand-crafted research, >> Sign up for the FREE iSPYETF Newsletter
|
