Gold is having another bad year, and most ‘pros’ are looking for even more losses:
-
“Gold teeters near five-year low after ‘bear raid’, more losses expected” – Reuters
-
“3 Trends that are burying gold prices” – CBC News
-
“Why gold is falling and won’t get up again” – MarketWatch
-
“The one chart that shows that gold may not be as safe as you think” – The Independent
Every gold bear should know that the market has a nasty habit: It likes to fool the crowded trade.
Based on the above headlines, short gold is the crowded trade.
Past experience has shown that using a combination of seasonality, sentiment and technical analysis to project (or at least try to project) gold prices is most effective.
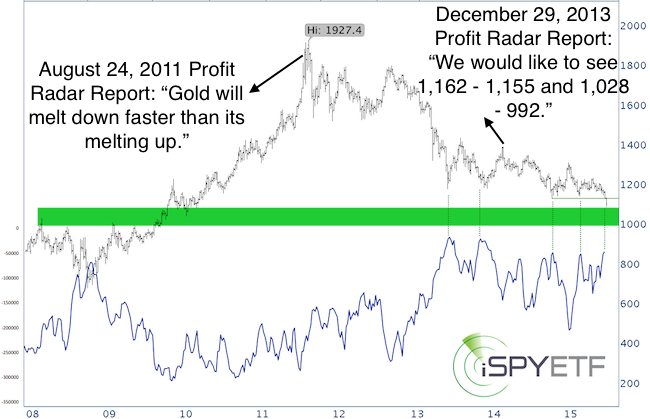
Using this approach helped prepare for the September 2011 all-time high (August 24, 2011 Profit Radar Report: “Gold will melt down faster than its melting up. At some point investors will have to sell holdings to pay of debt or answer margin calls. The most profitable asset is sold first. Gold has been the best performing asset for a decade and a liquidity crunch could produce sellers en masse”).
The December 29, 2013 Profit Radar Report built a case for new lows around 1,000:
“We would like to see a new low (below the June low at 1,178). There’s support at 1,162 – 1,155 and 1,028 – 992. Depending on the structure of any decline, we would evaluate if it makes sense to buy around 1,160 or if a drop to 1,000 +/- is more likely.”
Gold did bounce right around 1,162 – 1,155 last year, but is now coming back to test 1,028 – 992.
Here’s an updated look at seasonality, sentiment and technical analysis:
Seasonality
Gold seasonality projected a rough second half of July, but is turning significantly bullish in early August.
You may view the gold seasonality chart here: Gold Seasonality Chart
If you enjoy quality, hand-crafted research, >> Sign up for the FREE iSPYETF Newsletter
Sentiment
Most gold sentiment gauges are nearing extremes. Trend followers (the crowded trade) are bearish, but business insiders (smart money) are anticipating higher prices.
The chart above plots gold prices against the net futures positions of commercial hedgers (= people or entities in the business of mining, transporting or trading gold).
This is the latest available data, but since the CFTC reports on Friday (using data of Tuesday), it is already over a week old. Chances are commercials are even more bullish now than shown on the chart.
Regardless, commercial hedgers have scaled down their short exposure in anticipation of rising prices. Their timing is not always right on the money, but they rarely end up on the wrong side of the trade.
Technical Analysis
Gold is nearing a long-term support zone. A new low against a bullish RSI divergence, panic selloff (which Monday could have been) or move back above 1,135 is likely to spark a tradable rally.
This doesn’t mean gold won’t resume its decline later on, but prices appear to be near a short-term exhaustion point.
Simon Maierhofer is the publisher of the Profit Radar Report. The Profit Radar Report presents complex market analysis (S&P 500, Dow Jones, gold, silver, euro and bonds) in an easy format. Technical analysis, sentiment indicators, seasonal patterns and common sense are all wrapped up into two or more easy-to-read weekly updates. All Profit Radar Report recommendations resulted in a 59.51% net gain in 2013 and 17.59% in 2014.
Follow Simon on Twitter @ iSPYETF or sign up for the FREE iSPYETF Newsletter to get actionable ETF trade ideas delivered for free.

If you enjoy quality, hand-crafted research, >> Sign up for the FREE iSPYETF Newsletter
|
