Subscribers to iSPYETF’s free e-mail newsletter receive a market outlook, usually once a week. The market outlook below was sent out on March 4, 2021. If you’d like to sign up for the free e-newsletter, you may do so here (we will never share your e-mail with anyone, just as we don't accept advertising).
The last few Market Outlook e-mails outlined why stock market risk is very elevated and last week's e-mail warned that: "In addition to red hot enthusiasm a number of breadth studies even flashed a 'too much of a good thing' warning."
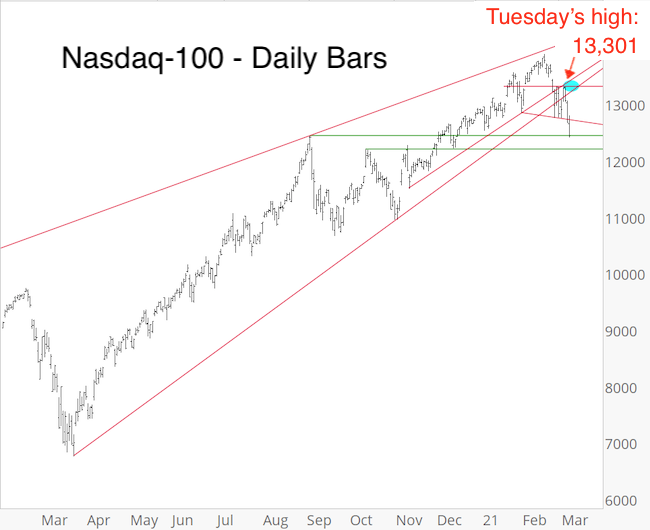
The Nasdaq-100, led by TSLA (see analysis below), fell below double trend line support last week.
Sunday's Profit Radar Report stated that: "Odds of a bounce to start the week are high (a test of the previously broken support, now resistance around 13,300, is quite common). We would prefer for selling to resume (ideally Monday or Tuesday)."
Tuesday's high was 13,301, today's low (thus far): 12,326. Nasdaq down almost 1,000 points in 3 days.
Yesterday's Profit Radar Report reemphasized and warned that:
1) The S&P 500 could be approaching a powerful wave 3 lower.
2) Short interest has been very low and without short sellers the risk of an air pocket drop is elevated.
The S&P 500 has joined the Nasdaq in falling below the March 2020 trend line. This trend line has now turned from support into resistance and downside risk should be respected as long as resistance holds or support is recognized.
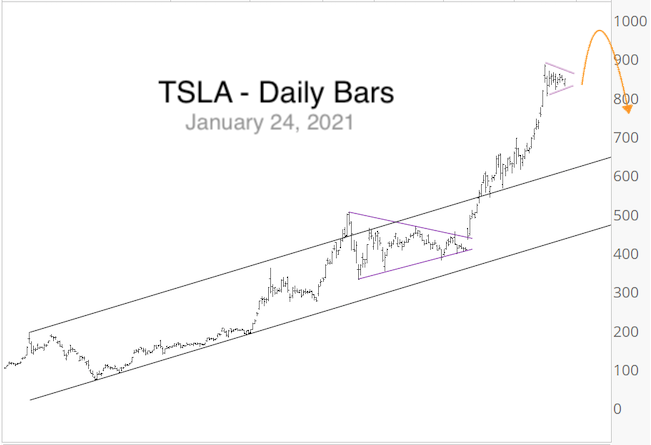
The January 24 Profit Radar Report included the following warning and price projection for TSLA: "TSLA paused at 884 and started carving out another triangle, which could be a smaller wave 4 before before the last spike into a quickly reversed all-time high (yellow arrow)."
Everyone is a genius in a bull market. Quite frankly, throughout December and January ignorance was literally bliss ... but a good old-fashioned analytical approach to investing may once again be more prudent then 'buy everything.'
I wanted to share a few e-mails received this week.
"I really appreciate your take on the markets and really liked today's analysis. I think a lot of people could benefit from it." - E. B
"Hi Simon, you are doing a good job right now. Everything you say the market does." - A. B.
"My subscription is up the first week of April. Please let me know when it's time to renew. I want to stay on board with you." - D. B.
"As always great stuff." - B. V.
To help readers, I've made the entire February 28 Profit Radar Report available. It is posted here. Notice the concise and cohesive stock market summary despite the various individual market index patterns. This update also includes analysis on gold, Treasuries (TLT) and TSLA.
Continued updates and the new 2021 S&P 500 Forecast are available via the Profit Radar Report.
The Profit Radar Report comes with a 30-day money back guarantee, but fair warning: 90% of users stay on beyond 30 days.
Barron's rates iSPYETF a "trader with a good track record," and Investor's Business Daily writes "Simon says and the market is playing along."
|
