|
|
| Fascinating AAPL Formation Telegraphed Bullish Breakout |
| By, Simon Maierhofer
|
| Monday April 27, 2015 |
|
|
|
|
| One of the most fascinating AAPL chart formations telegraphed AAPL’s up side pop. The pattern suggests further up side. Long-term resistance levels form a very plausible up side target, and potential reversal zone. |
|
The April 22 Profit Radar Report highlighting this fascination AAPL (Nasdaq: AAPL) formation with the following commentary:
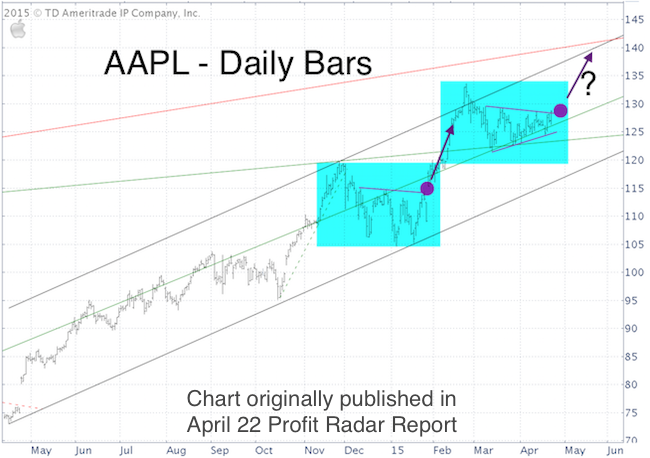
“AAPL, the most important stock in the world, hasn’t been able to nudge the S&P, Dow Jones or Nasdaq in either direction. That’s because AAPL is stuck in its own trading range/triangle. The consolidation pattern is similar to that of Q3 2014. AAPL closed at 128.62 today. This mini-breakout increases the odds of more upside.”
Never Miss a Beat! >> Sign up for the FREE iSPYETF e-Newsletter
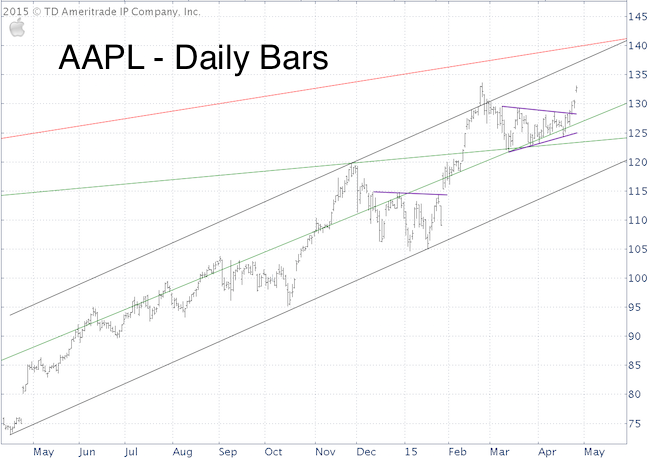
Below is an update AAPL chart. The next meaningful resistance cluster is around 140, but the open chart gap (and various breadth divergences) allows for a ‘digestive pullback’ at any time. In terms of Elliott Wave Theory, any new high could complete a 5-wave move and result in a larger-scale reversal.
AAPL’s pop also propelled the Nasdaq-100 and PowerShares QQQ ETF (Nasdaq: QQQ) out of a formation called a bull flag. More details here: Nasdaq QQQ ETF Break out of Bull Flag
Simon Maierhofer is the publisher of the Profit Radar Report. The Profit Radar Report presents complex market analysis (S&P 500, Dow Jones, gold, silver, euro and bonds) in an easy format. Technical analysis, sentiment indicators, seasonal patterns and common sense are all wrapped up into two or more easy-to-read weekly updates. All Profit Radar Report recommendations resulted in a 59.51% net gain in 2013 and 17.59% in 2014.
Follow Simon on Twitter @ iSPYETF or sign up for the FREE iSPYETF Newsletter to get actionable ETF trade ideas delivered for free.

Never Miss a Beat! >> Sign up for the FREE iSPYETF e-Newsletter
|
|
|
|
|
|
|
|
|
|
|
|
|
|
